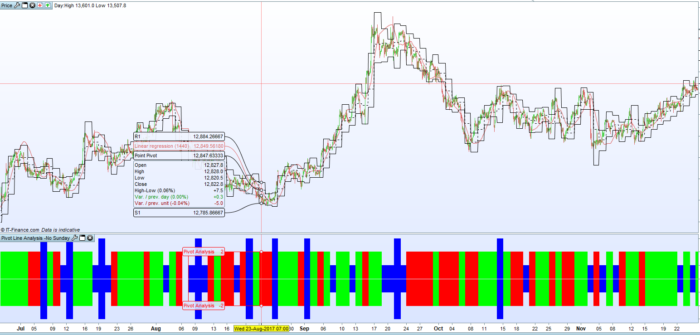
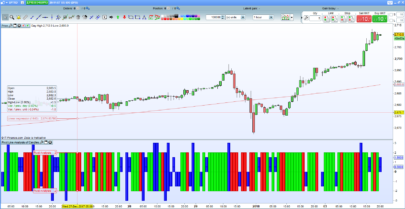
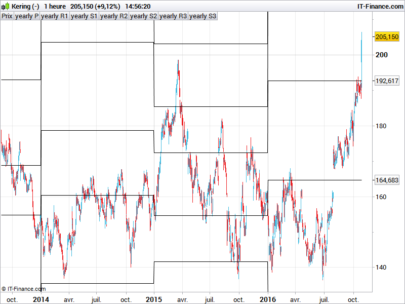
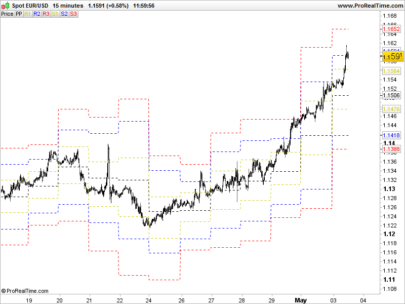
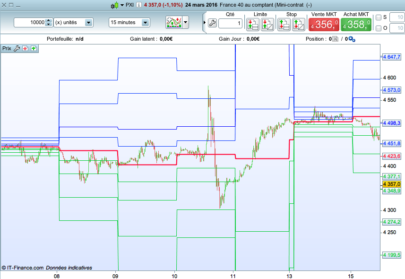
Analysis of today’s pivot line positions relative to yesterdays pivot line positions can give us a very good idea of market sentiment.
This simple indicator helps us see market sentiment at a glance. It can be applied on any time frame and any market.
- Rising Pivots. If today’s R1 is higher than yesterdays R1 and today’s S1 is higher than yesterdays S1 then sentiment is bullish.
- Falling Pivots. If today’s R1 is lower than yesterdays R1 and today’s S1 is lower than yesterdays S1 then sentiment is bearish.
- Outside Pivots. If today’s R1 is higher than yesterdays R1 and today’s S1 is lower than yesterdays S1 then the bulls and bears had a big fight resulting in increased volatility and the market may be at a point of indecision.
- Inside Pivots. If today’s R1 is lower than yesterdays R1 and today’s S1 is higher than yesterdays S1 then the bulls and bears had a very evenly matched fight and the market may be at a point of indecision.
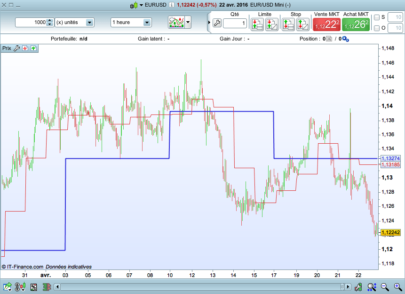
A green bar indicates that yesterday was a bullish day.
A red bar indicates that yesterday was a bearish day.
A long blue bar indicates that yesterday was a more volatile day that neither side won.
A short blue bar indicates that yesterday was a day of indecision.
The latter two are of the most interest and can be used to predict possible changes of market direction.
I have written a simple strategy based on this theory which is currently under forward testing. Hopefully to be shared later!
|
1 2 3 4 5 6 7 8 9 10 11 12 13 14 15 16 17 18 19 20 21 22 23 24 25 26 27 28 29 30 31 32 33 34 35 36 37 38 39 40 41 42 43 44 45 46 47 48 49 50 51 52 53 54 55 56 57 58 59 60 61 62 63 64 65 66 67 68 69 70 71 72 73 74 75 76 77 78 79 80 81 82 83 84 85 86 87 88 89 90 91 92 |
a1=OpenDayOfWeek b1=DHigh(1) b2=DHigh(2) c1=DLow(1) c2=DLow(2) d1=DClose(1) d2=DClose(2) IF a1=1 THEN b1=b2 c1=c2 d1=d2 ELSE b1=b1 c1=c1 d1=d1 ENDIF H1 = b1//High L1 = c1//Low C = d1//Close aa1=OpenDayOfWeek bb1=DHigh(2) bb2=DHigh(3) //bb3= DHigh(3) cc1=DLow(2) cc2=DLow(3) //cc3=DLow(1) dd1=DClose(2) dd2=DClose(3) //dd3=DClose(1) IF aa1=7 or aa1=1 or aa1=2 THEN bb1=bb2 cc1=cc2 dd1=dd2 ELSE bb1=bb1 cc1=cc1 dd1=dd1 ENDIF HH1 = bb1//High LL1 = cc1//Low CC = dd1//Close //Pivot1 = (HH1 + LL1 + CC) / 3 R11 = 2*((HH1 + LL1 + CC) / 3)- LL1 S11 = 2*((HH1 + LL1 + CC) / 3)- HH1 //Pivot = (H1 + L1 + C) / 3 R1 = 2*((H1 + L1 + C) / 3)- L1 S1 = 2*((H1 + L1 + C) / 3)- H1 //Outside Pivot IF R1 > R11 and S1 < S11 THEN Flagup = 3 FlagDown = -3 R = 0 G = 0 B = 255 ENDIF //Up Pivot IF R1 > R11 and S1 > S11 THEN Flagup = 2 FlagDown = -2 R = 0 G = 255 B = 0 ENDIF //Down Pivot IF R1 < R11 and S1 < S11 THEN Flagup = 2 FlagDown = -2 R = 255 G = 0 B = 0 ENDIF //Inside Pivot IF R1 < R11 and S1 > S11 THEN FlagUp = 1 FlagDown = -1 R = 0 G = 0 B = 255 ENDIF return FlagUp coloured(R,G,B) Style(Histogram,2) as "Pivot Analysis",FlagDown coloured(R,G,B) Style(Histogram,2) as "Pivot Analysis" |
Share this
No information on this site is investment advice or a solicitation to buy or sell any financial instrument. Past performance is not indicative of future results. Trading may expose you to risk of loss greater than your deposits and is only suitable for experienced investors who have sufficient financial means to bear such risk.
ProRealTime ITF files and other attachments :
Find other exclusive trading pro-tools on ![]()
PRC is also on YouTube, subscribe to our channel for exclusive content and tutorials
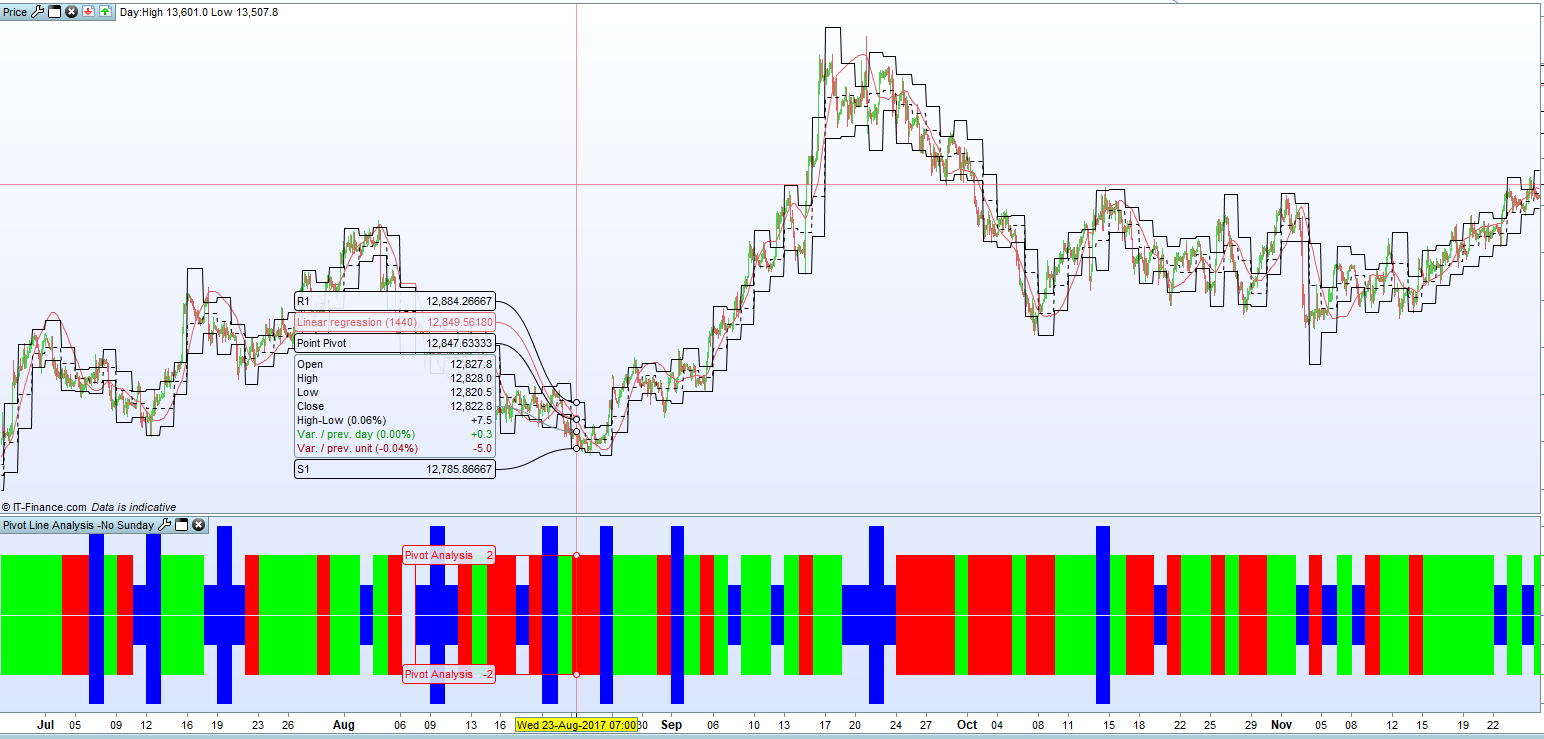
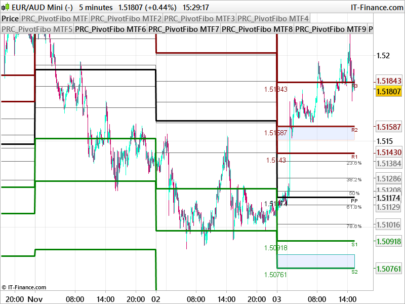


I forgot to mention in the description that Sunday pivot lines are ignored and Monday’s pivot lines are calculated from Fridays price movements.
Like that, simple and clear!
Thanks AVT. I like simple – some people would say that I do simple very well! Sometimes you don’t need all the bells and whistles to work out market sentiment.