







Pivot points intraday
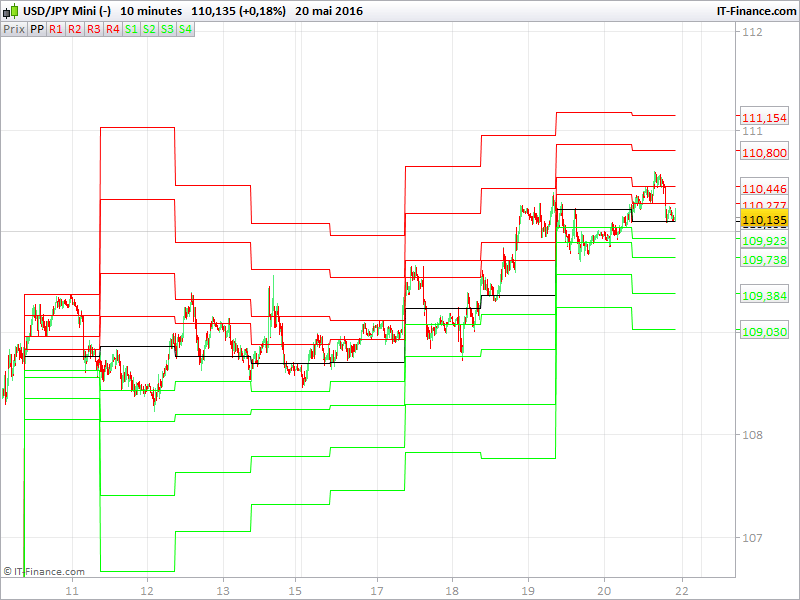
Found this code of interest on a NL Prorealtime forum for someone requesting an intraday pivot points indicator. Nicely coded and would surely be of interest of other people around here, I add it to library.
The variables ‘myStartHour’, ‘myStartMinute’, ‘myEndHour’ and ‘myEndMinute’ may be changed to any start and end time for the pivot points calculation.
// Variable Pivots
// by Smoke

// Zeitvariable
myStartHour = 7
myStartMinute = 0
myEndHour = 9
myEndMinute = 0

// umrechnung Zeit
start = (myStartHour * 10000) + (myStartMinute * 100)
ende = (myEndHour * 10000) + (myEndMinute * 100) + 1000

// Hoch-Tief-Close  Berechnung
Once myHigh = 0
Once myLow = 1000

If (Day > Day[1]) Then
 myLow = Low
 myHigh = High
 myClose = Close
Endif

If (Time >= start) Then
 myClose = Close
  If High > myHigh Then
   myHigh = High
  Else
   myHigh = myHigh[1]
 Endif
 If (Time > ende) Then
  myHigh = myHigh[1]
  myClose = myClose[1]
 Endif
 If Low < myLow Then
  myLow = Low
 Else
  myLow = myLow[1]
 Endif
 If (Time > ende) Then
  myLow = myLow[1]
 Endif
Endif

If Time >= ende Then

// PP-Berechnung
 PRange = ABS(myHigh - myLow)
 PP = (myHigh + myLow + myClose) / 3

 R1  = 2 * PP - myLow
 R22 = PP + PRange
 R3  = PP + PRange * 2
 R4  = PP + PRange * 3

 S1  = 2 * PP - myHigh
 S2  = PP - PRange
 S3  = PP - Prange * 2
 S4  = PP - PRange * 3

Endif


Return PP coloured(0,0,0) as "PP", R1 coloured(255,0,0) as "R1", R22 coloured(255,0,0) as "R2", R3 coloured(255,0,0) as "R3", R4 coloured(255,0,0) as "R4", S1 coloured(0,255,0) as "S1", S2 coloured(0,255,0) as "S2", S3 coloured(0,255,0) as "S3", S4 coloured(0,255,0) as "S4"
Comments
You must be logged in to post a comment.
Thanks for the input and your opinion, but IMO, the pivot points are ones of the best support and resistance lines for intraday trading. Both daily, weekly and monthly are great points of "rendez-vous" for a lot of traders and therefore can be used for targets and rejections orders. There is no single way to benefit from the market, but i know for sure that if you act like many others do, you should be in the right direction.

Hi Nicola, I wanted to know an information. After optimizing a strategy (unit 10 min backtest time 1 year) I continue the all with 5-step Walk Forward not anchored and choose the variables it reports to 50% or higher. After validating the system, I perform the last validity with the method Walk Forward to a period. The questions I ask you are: 1- we hypothesize that the strategy is ok and that it is real, 1 year divided by 5 is equal to 2.5 months , time of "expiration" of the strategy. After the expiration period I have to make a optimization or validity with the walk forward method and how many periods? 2- If a strategy optimized and tested with the WF method has percentages higher than 150% how can I behave? 3- What is the optimal percentage of validity with the Walk Forward method? 70% -30% or 60% -40%? 4- When optimizing variables or the WF method is it important to update several variables together or one variable at a time? Thanks

Nice code Nicholas and well done on writing it but in my opinion and mine only pivot points hold zero value to actual trading . About as useful as Fibonacci , before enyone jumps down my throat go find a bell curve distribution of retrace levels and you will see there is a wide fat part of the curve that really serves no purpose predictively . IE there is no usable probability that will challenge random entry/exit . Not trying to be negative just putting it out there . Have a read of " Evidence-Based Technical Analysis: Applying the Scientific Method and Statistical Inference to Trading Signals Book by David Aronson "