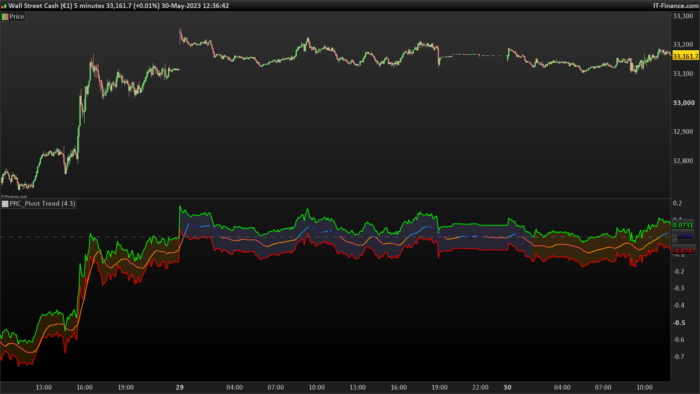
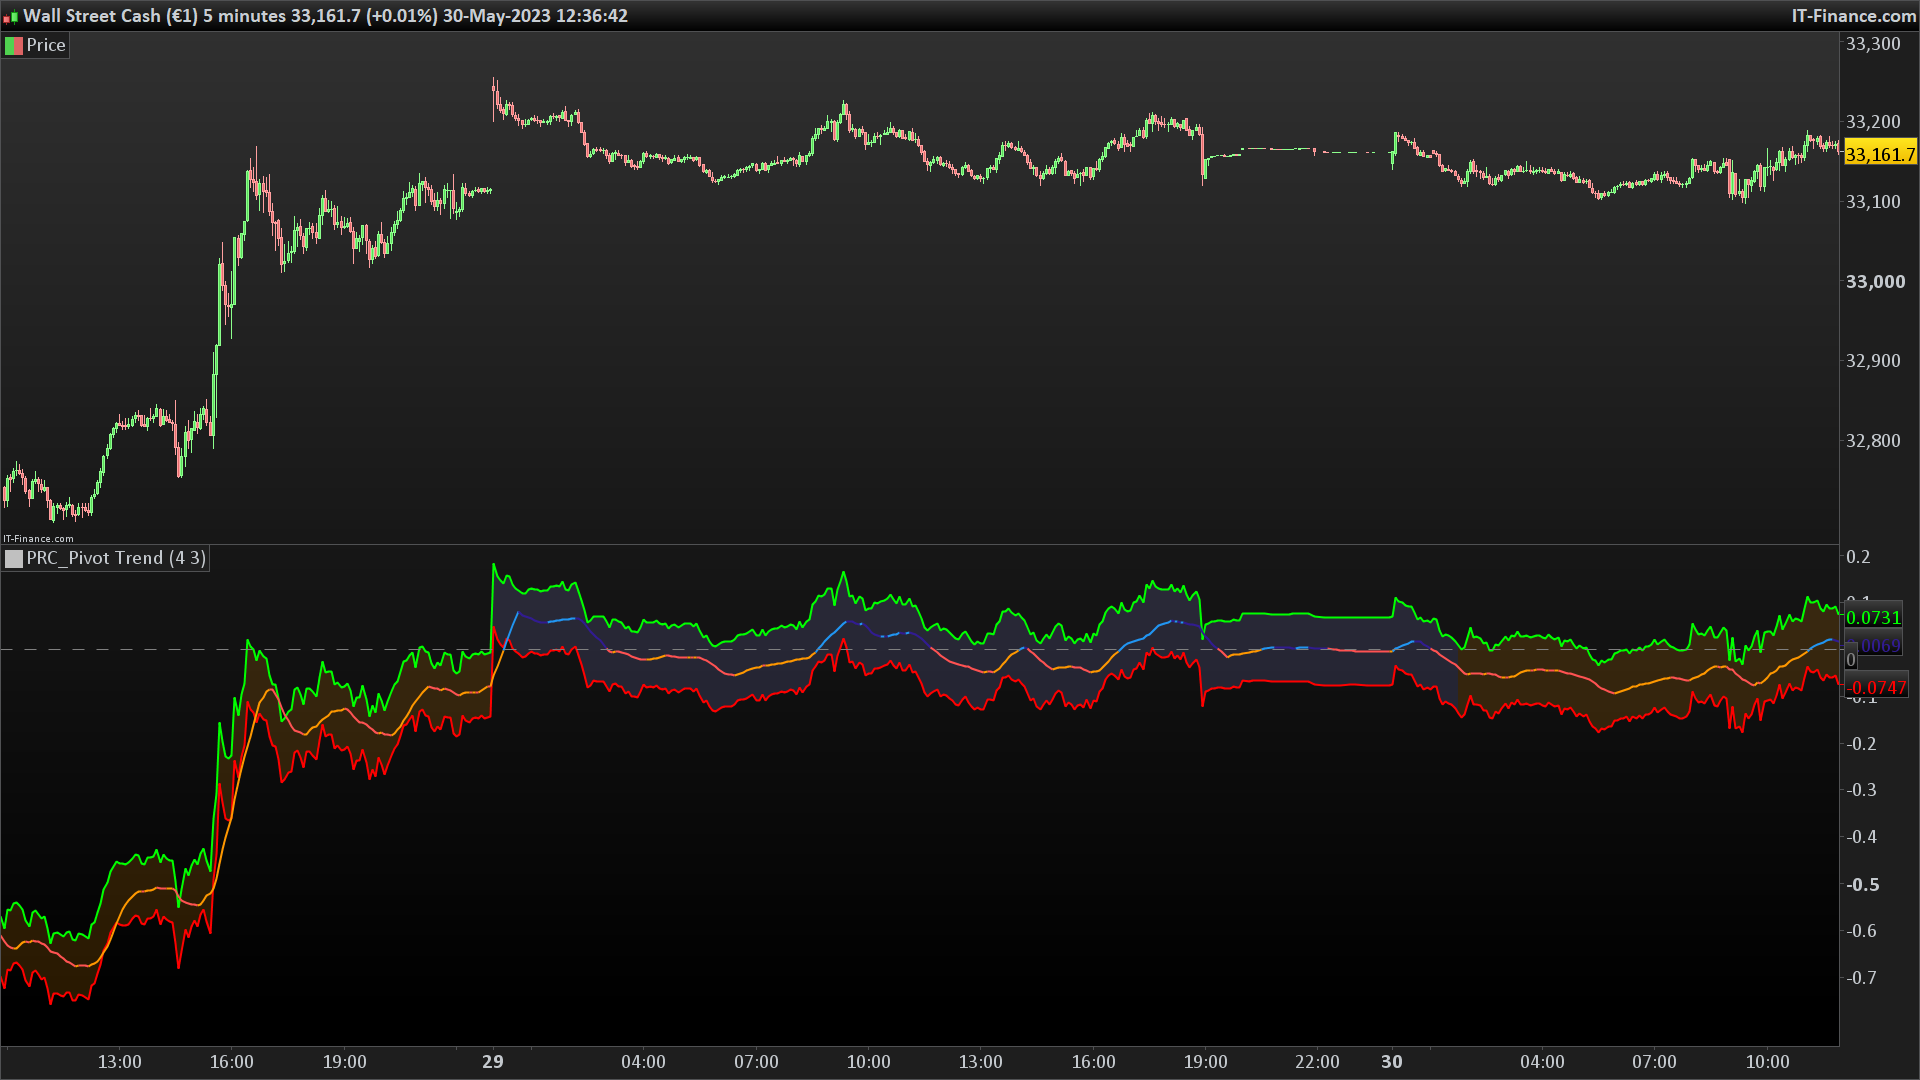
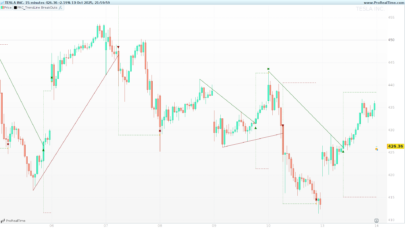
it’s a breakout strategy that uses multiple Pivot Point’s averages.
How it works?
- it finds the Pivot Points, you can set the length as you want
- it gets averages of Pivot Highs and Pivot Lows, you can set the number of Pivot Points to be included
- it compares the current closing price with averages of Pivot Highs and Pivot Lows
- if both are positive or negative then trend changes
You have two options:
- Pivot Point Period => is the length that is used to find Pivot Points. means it checks left/right bars if it’s Pivot Point (4 by default)
- Number of PP to check => is the number of Pivot Points that the script finds and calculates the averages (3 by default)
(description from original author LonesomeTheBlue)
|
1 2 3 4 5 6 7 8 9 10 11 12 13 14 15 16 17 18 19 20 21 22 23 24 25 26 27 28 29 30 31 32 33 34 35 36 37 38 39 40 41 42 43 44 45 46 47 48 49 50 51 52 53 54 55 56 57 58 59 60 61 62 63 64 65 66 67 68 69 70 71 72 73 74 75 76 77 78 79 80 |
//PRC_Pivot Trend | indicator //17.04.23 //Nicolas @ www.prorealcode.com //Sharing ProRealTime knowledge //author: LonesomeTheBlue // --- settings prd = 4 //Pivot Point Period pnum = 3 //number of PP to check // --- end of settings once BarsAfter = prd once BarsBefore = prd once BarLookBack = prd + 1 IF low[BarsAfter] < lowest[BarsBefore](low)[BarLookBack] THEN IF low[BarsAfter] = lowest[BarLookBack](low) THEN $pllev[x] = low[BarsAfter] x=x+1 ENDIF ENDIF IF high[BarsAfter] > highest[BarsBefore](high)[BarLookBack] THEN IF high[BarsAfter] = highest[BarLookBack](high) THEN $phlev[y] = high[BarsAfter] y=y+1 ENDIF ENDIF lrate = 0.0 for i = 0 to lastset($pllev) - 1 rate = (close - $pllev[i]) / $pllev[i] lrate = lrate+(rate / pnum) next hrate = 0.0 for i = 1 to lastset($phlev) - 1 rate = (close - $phlev[i]) / $phlev[i] hrate = hrate+(rate / pnum) next trend = 0 if hrate>0 and lrate>0 then trend=1 elsif hrate<0 and lrate<0 then trend=-1 endif if trend=1 then r=33 r=150 b=243 elsif trend=-1 then r=255 g=152 b=0 endif colorbetween(hrate,lrate,r,g,b,40) mid = average[9]((hrate + lrate) / 2) if mid>=0 then if mid>=mid[1] then cr=33 cg=150 cb=243 else cr=49 cg=27 cb=146 endif else if mid<=mid[1] then cr=255 cg=82 cb=82 else cr=255 cg=152 cb=0 endif endif return hrate coloured("red") style(line,2), lrate coloured("lime") style(line,2), mid style(line,2) coloured(cr,cg,cb),0 style(dottedline2) coloured("grey") |
Share this
No information on this site is investment advice or a solicitation to buy or sell any financial instrument. Past performance is not indicative of future results. Trading may expose you to risk of loss greater than your deposits and is only suitable for experienced investors who have sufficient financial means to bear such risk.
ProRealTime ITF files and other attachments :PRC is also on YouTube, subscribe to our channel for exclusive content and tutorials




Well done Nicolas, creative!
Hi Nicolas, please can you explain how to read/use this indicator?
thanks!