Pivot Trend

Pivot Trend

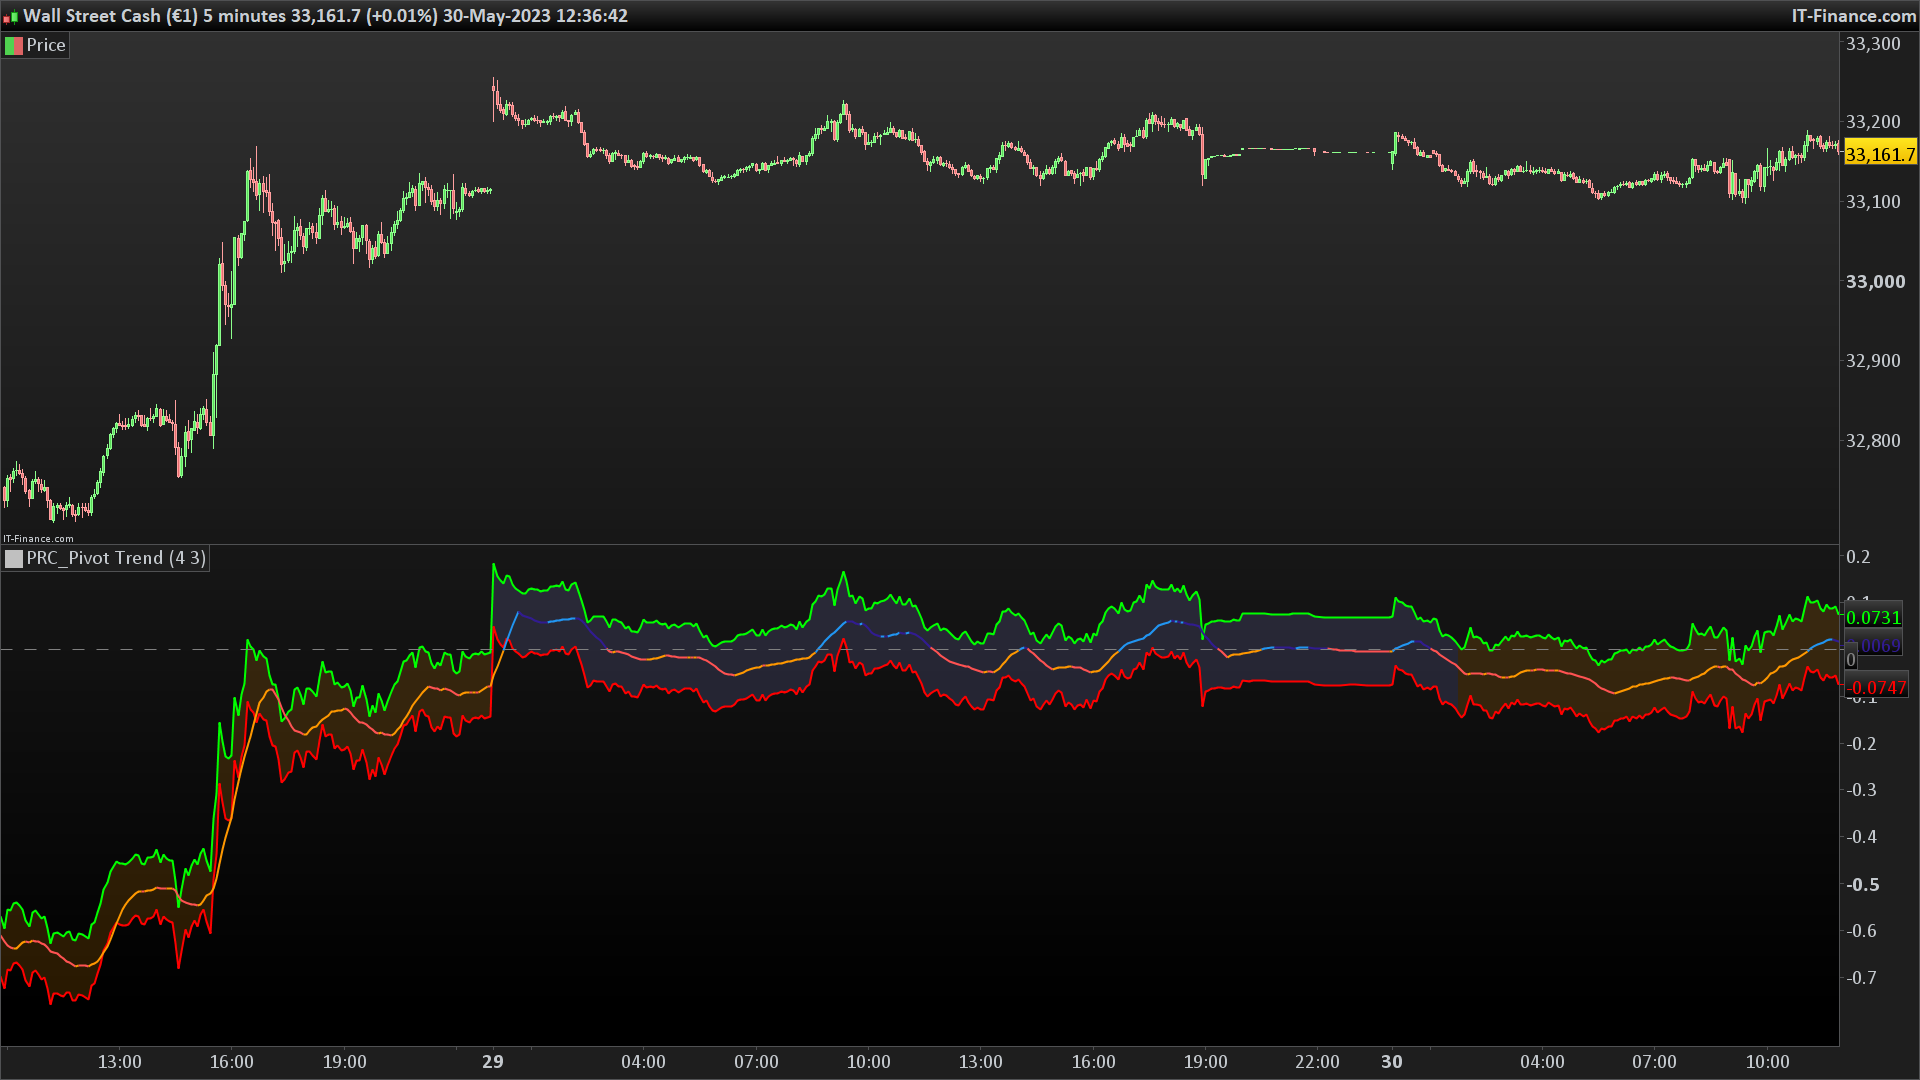
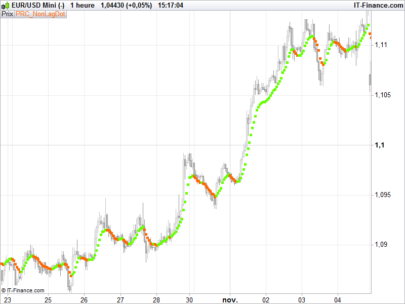
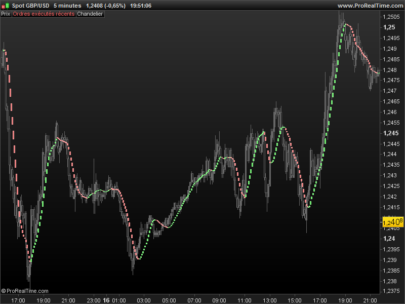
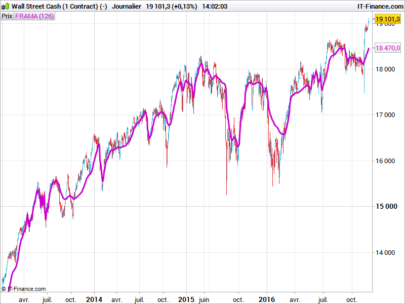
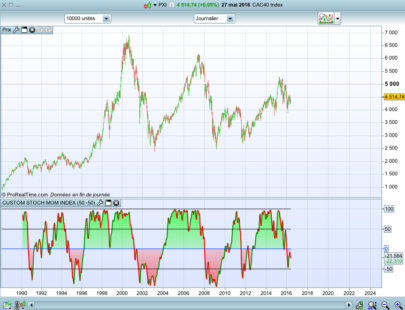
it’s a breakout strategy that uses multiple Pivot Point’s averages.

How it works?

  • it finds the Pivot Points, you can set the length as you want
  • it gets averages of Pivot Highs and Pivot Lows, you can set the number of Pivot Points to be included
  • it compares the current closing price with averages of Pivot Highs and Pivot Lows
  • if both are positive or negative then trend changes

You have two options:

  • Pivot Point Period => is the length that is used to find Pivot Points. means it checks left/right bars if it’s Pivot Point (4 by default)
  • Number of PP to check => is the number of Pivot Points that the script finds and calculates the averages (3 by default)

(description from original author LonesomeTheBlue)

Share this

Risk disclosure:

No information on this site is investment advice or a solicitation to buy or sell any financial instrument. Past performance is not indicative of future results. Trading may expose you to risk of loss greater than your deposits and is only suitable for experienced investors who have sufficient financial means to bear such risk.

ProRealTime ITF files and other attachments : How to import ITF files into ProRealTime platform?

PRC is also on YouTube, subscribe to our channel for exclusive content and tutorials

  1. Maxime Baudin • 05/30/2023 #

    Well done Nicolas, creative!

  2. Stenozar • 05/30/2023 #

    Hi Nicolas, please can you explain how to read/use this indicator?
    thanks!

avatar
Register or

Likes

avatar avatar avatar avatar avatar
Related users ' posts
Lyam Pareil ne marche pas dommage
ahmedbouaziz89 Bonjour, quand j'ajoute le code ou le fichier dans l'outils screeners de Prorealtime je ne v...
tyvix Bonjour le code marche bien c est juste qu'il n y a pas d opportunité au moment ou vous le...
verdi55 Is there such a thing as a free lunch ?
maceng Thanks Nicolas for this great work! I would like to understand the math behind it in order t...
Nicolas Sorry I have no time to provide assistance for python programmers. Have a good day.
Maz Hi all, firstly happy to know that this is helping you. I look into updating it for PRT11 wh...
Nicolas just use 3 times a linear regression channel code you will find in the library.
leederbyshire Here's the link to alternative linear regression channel indicator Nicolas is referring to t...
Wing Yes, investigate as much as you want. For more insight, you can view the linet1, linet2 etc....
CKW Hi Wing, Thanks for your sharing. I am still trying to breakdown & understand your code...
Wing Hello CKW. No, the parameter, 7 in this case, is used when calling the RSI indicator to ide...
Nicolas Je vais faire l'indicateur et expliquer comment en même temps dans un sujet de forum. Plus s...
gregus merci nicolas toute ma gratitude est pour toi sa sera bien pratique car je pense ne pas etre...
Nicolas Ok merci donc d'ouvrir un sujet spécifique pour cette demande donc :) 
algotrader This indicator looks coolBut on attempt to use it for a strategy dev'I get an error.."The in...
dajvop @algotrader if you at the bottom of the code add: RETURN Buffer1 as "up", Buffer2 as "down",...
Bateson Si cela peut servir, l'indicateur Sadukey a été créé en utilisant un générateur de filtre ap...
dakaodo Hi, Wilko. Acc to the original FRAMA paper by Ehlers, Ehler's own code only takes inputs for...
dakaodo For reference, here is Ehlers' original paper: http://www.mesasoftware.com/papers/FRAMA.p...
dakaodo Here is the code with only SC included, per ETFHQ. pri=customclose //len>=4, even on...
Nicolas
8 years ago
haseluis Hello Niklas, I would like to use the screener for the display in the m15, which changes to ...
Nicolas Nothing to change or you can play with different settings at lines 6 and 7.
haseluis Thank you Niklas, I'm still looking for an indicator 123 or direct to Joe Ross, can you help...
juju333 Merci Nicolas, j'utilisais avec bonheur ce code dans la 10.3, il ne tourne plus dans la v11....
Nicolas Remplacer les lignes 11 et par 12 avec: yearlyHigh = Highest[max(1,BarIndex - lastYearBarI...
juju333 merci !!!
zilliq Be careful, It works only if you are in daily timeframe, and on your graphic you are on hou...
DerPat I guess you are right, like always. If you change n to 24 you have at least the hours of a d...
gabri DerPat, you can also change line1 to read as follow to adapt this script to hourly timefram...
Nicolas
9 years ago
ALMA MACD
ALMA MACD
7
Indicators
Arnaud HALVICK Great indicator, thank you!
JMat45 Hi Nicolas, just reviewing this indicator and noticed that you have double assigned the vari...
Nicolas That would not make any difference because the code is read from top to bottom.
roos Hi Nicolas, another really helpful bit of code, thank you! Can I ask how you might amend so ...
Denis Good evening Nicolas, could you tell me where thae arrows on the chart come from ? I don't s...
Nicolas there is no arrow in this indicator.
MikeGC I don't know if you have used the variables a and b to optimise the parameters for the Super...
gianpiero75 I have not optimized, I multiplied the parameters for 6 (5,8), to use them on the 4  hoursTF...
bertrandpinoy bonjour Mike j utilise TrendChaser V2.0 et quand il prend position cela ne programme pas le ...
Nicolas
9 years ago
Nicolas add it on price chart, change the cp parameter according to the period you want to observe f...
Robert22 hola buenos días: yo estoy buscando una cosa parecida para realizar con ello un indicador de...
Nicolas https://www.prorealcode.com/prorealtime-indicators/rsi-classical-hidden-divergences-indicator/
eisi If i switch between different Markets, the Backgroundcolour will appear where it should not...
datageek How can I get alerts on colour change?
NAMBO40 Hello, I would like to add a 25 period SMA moving average. It's possible?
Fabio Anthony Terrenzio this strategy works only in a well defined trend
brosly Good afternoon I am trying to get the complete code of lex strategy made by adolfo since I s...
dreif123 hi Adolfo, is Alex Auto Trading Botindex working on DAX as well ? if so , can you post the...
Doctrading I forgot to write at the beginning :  a = 50 b = 50 These are intermediate levels Sorry
DerPat Thank you. This one could be an aid in my current research on stochastics.
Pelayo it is possible that in line 12 we should put seuilinf=-b, thaks for all
Doctrading Hello, Someone asked me something (his results seemed to be different) on my email, but it ...
Glen Marquis Not your best..So what is your best strategy? :)
Grantx When I add this code, the indicator appears in the panel below price. How do I get it to dis...
Patrik72 Hello, thank you very much for the great indicator. One question, is it possible just have l...
datageek is it possible to add Mid pivot points (midR1 and MidS1)?
Nicolas Dans l'onglet prix, choisir d'appliquer l'échelle qu'au prix uniquement.
Eloi MERCI

Top