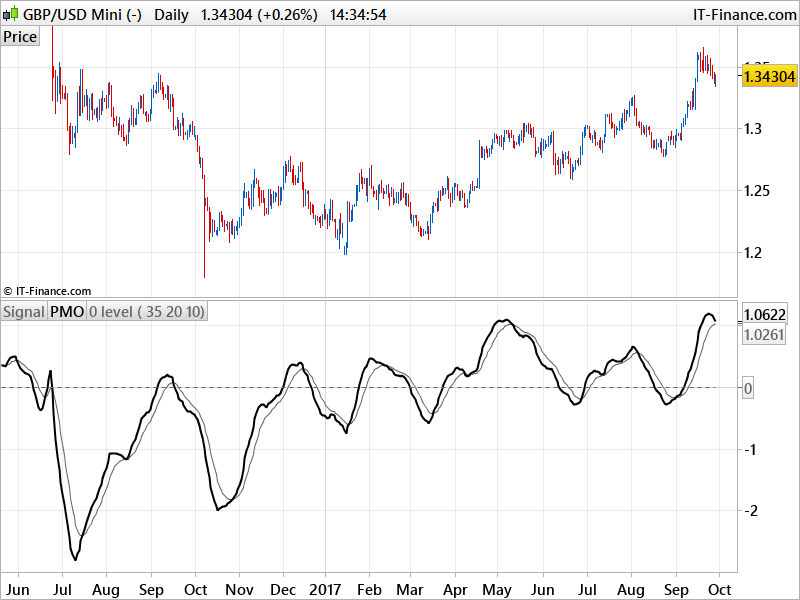
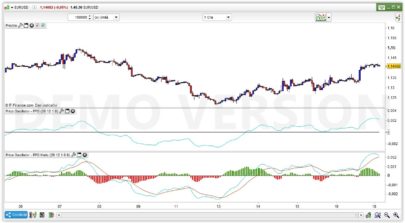
The Price Momentum Oscillator (PMO) is an oscillator based on a Rate of Change (ROC) calculation that is smoothed twice with exponential moving averages that use a custom smoothing process. Because the PMO is standardized, it can also be used as a relative force tool.
The Price Momentum Oscillator is derived by taking a one period rate of change and smoothing it with two custom smoothing functions. The custom smoothing functions are very similar to Exponential Moving Averages but instead of adding one to the time period setting to create the smoothing multiplier (as in a true EMA), the smoothing functions just use the period by itself.
|
1 2 3 4 5 6 7 8 9 10 11 12 13 14 15 16 17 18 19 20 21 22 23 24 25 26 27 |
//PRC_Price Momentum Oscillator //28.09.2016 //Nicolas @ www.prorealcode.com //Sharing ProRealTime knowledge // --- settings //length1=35 // "First Smoothing" //length2=20 //"Second Smoothing" //siglength=10 //"Signal Smoothing" // --- end of settings if barindex>1 then i = (close/close[1])*100 sm1 = 2.0/length1 csf1=((i-100)-csf1[1])*sm1+csf1[1] pmol2=csf1 sm2 = 2.0/length2 csf2=((10*pmol2)-csf2[1])*sm2+csf2[1] pmol=csf2 pmols=average[siglength,1](pmol) endif return pmols coloured(100,100,100) as "Signal", pmol coloured(0,0,0) style(line,2) as "PMO", 0 coloured(100,100,100) style(dottedline) as "0 level" |
Share this
No information on this site is investment advice or a solicitation to buy or sell any financial instrument. Past performance is not indicative of future results. Trading may expose you to risk of loss greater than your deposits and is only suitable for experienced investors who have sufficient financial means to bear such risk.
ProRealTime ITF files and other attachments :PRC is also on YouTube, subscribe to our channel for exclusive content and tutorials



Bonjour Nicolas
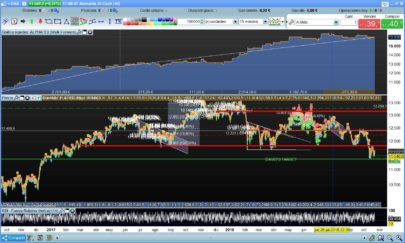
Ne peut-on pas coder ce même indicateur en le transformant ” ON CHART ” sur le graphique des prix ?
La lecture directe sur les prix est souvent bien plus lisible
merci et bonne journée
C’est un oscillateur, qui ne partage pas la même échelle et qui a subit une standardisation pour être “borné”, donc non je ne vois pas vraiment où cela nous mènerai 🙂
Thanks for sharing, Nicolas. Have you tested any strategy based on this oscillator? Would you share your findings, please?
Hi Nicolas.
Is it possible to code a screener? is not the first indicator doesn´t allow me to code. The error is not server found
Cheers
Sorry.. Internal server error
the same than others indicators
Sorry, you mean that you are not able to download the file?
when y try to code a simple screener let´s say signal cross over PMO, is not working and this error appears in the screener list.
Hi Nicolas, Do you have any solution for this problem?
Please add a request in proscreener section, much better to explain and understand your problem, thank you.
Bonjour Nicolas, et merci pour le partage.
Est il possible de créer une alerte sur le changement de direction ?
Merci par avance.
Oui c’est possible, merci de formuler une requête dans le forum des indicateurs de trading.
en copiant collant : erreur de syntaxe apparaît le popup demande de définir length1, length2 et siglenth que faut-il corriger ?
Merci
En téléchargeant le fichier itf et import dans la plateforme, vous n’aurez pas ces problèmes.
Bonjour Nicolas
un grand merci pour ce travail que je souhaiterai faire évoluer.
Je n’arrive pas à borner le PMO avec la même échelle que le RSI (ligne 50 médiane et 30-80 pour les plots).
Pouvez-vous m’aider ?
// — settings
//smooth1=7// “First Smoothing”
//smooth2=10 //”Second Smoothing”
//sign=4 //”Signal Smoothing”
if barindex>1 then
i = (close/close[1])*100
sm1 = 2.0/smooth1
csf1=((i-100)-csf1[1])*sm1+csf1[1]
pmol2=csf1*100
sm2 = 2.0/smooth2
csf2=((10*pmol2)-csf2[1])*sm2+csf2[1]
pmo=csf2+50
signal=average[sign,mmsign](pmo)
endif
//Bornes
DRAWHLINE(ob)
DRAWHLINE(os)
DRAWHLINE(50) STYLE (DOTTEDLINE3)
return signal as “Signal”, pmo as “PMO”