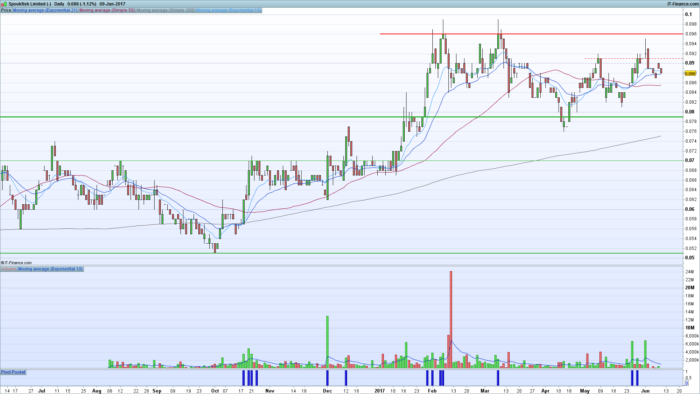
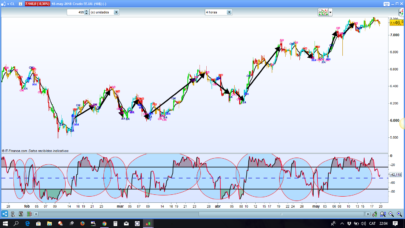
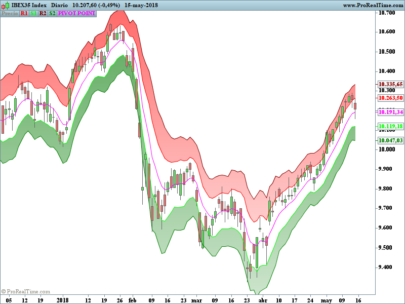
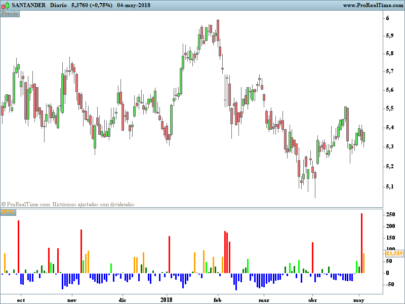
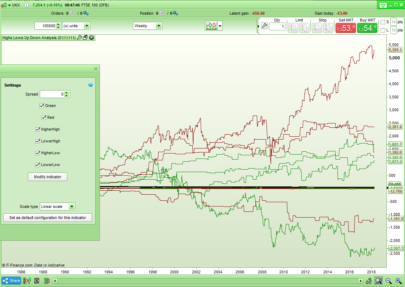
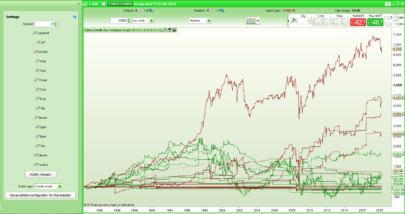
Pocket pivots based on Chris Kacher / Gil Morales.
Highest volume of last ten days, higher than any down day.
Stronger the trend the bettter.
Shows accumilation / re accumilation on up days / waves.
I change it to Histogram to get the nice blue bars.
Credit to who wrote this, I was given it over Twitter,
Cheers,
Dale.
|
1 2 3 4 5 6 7 8 9 10 11 12 13 14 15 16 17 18 19 20 21 22 23 24 25 26 27 28 29 30 31 32 33 34 35 36 37 38 39 40 41 42 43 44 45 46 47 48 49 50 51 52 53 54 55 56 57 58 59 60 61 62 63 64 65 66 67 68 69 70 71 72 73 74 75 76 77 78 79 80 81 82 83 84 85 86 87 88 89 90 91 92 93 94 95 96 97 98 99 100 101 102 103 104 105 106 107 108 109 110 111 112 113 114 115 116 117 118 119 120 121 122 123 124 125 126 127 128 129 130 131 132 133 134 135 136 137 138 139 |
// ---------------------------------- // The Pocket Pivot Screener // // ver 0.1 // 0.2 - using the max volume of a down day in the past 10 days // // ---------------------------------- // Basic criteria minPrice = 0.05 minVol = 10000 daysToConfirmUpTrend = 50 // Only scan leading stocks above minimal price and 40 day moving average of Volume is above 500000] cVol1 = (Close > minPrice AND Average[40](Volume) > minVol) // Trend is up and Today is an up day cPrc1 = (Close > Average[daysToConfirmUpTrend](Close) AND Close > Open) // Today's volume should be larger than the volume of the highest down day over the last 10 days maxDay = 11 maxDownDay = 0 maxDown = 0 FOR d = 1 TO maxDay DO r = Close[d] - Open[d] IF r < 0 and Volume[d] > maxDown THEN maxDown = Volume[d] maxDownDay = d ENDIF NEXT IF maxDownDay = 0 THEN maxDownDayVol = 0 ELSE maxDownDayVol = Volume[maxDownDay] ENDIF cVol2 = (Volume > maxDownDayVol) // Prices just moved above 10 or 50 day SMA and [[close x SMA(10,close)] or [close x SMA(50,close)]] cPrc2 = (Close >= Average[20](Close)) cPrc3 = (Close CROSSES OVER Average[10](Close) OR Close CROSSES OVER Average[50](Close)) // ** Other criteria to try ** // Short-Term Uptrend : 9 day MA above 20 day MA cPrc10 = (Average[9](Close) > Average[20](Close)) // Close in Upper Half of Daily Range cPrc11 = (Close > (High + Low) * 0.5) // In Short-term Consolidation: close < highest high of 10 Days cPrc12 = (Close[1] < highest[10](High)) // Not Extended or Already Broken Out: Close < highest close of 65 days cPrc13 = (Close < highest[65](Close)) // draw indicator ind1 = (cPrc1 AND cPrc2 AND (cPrc3 OR 1) AND cVol1 AND cVol2 AND (cPrc10 OR 1) AND (cPrc11 OR 1) AND (cPrc12 OR 1) AND (cPrc13 OR 1)) RETURN ind1 COLOURED(0, 0, 200) AS "Pivot Pocket" |
Share this
No information on this site is investment advice or a solicitation to buy or sell any financial instrument. Past performance is not indicative of future results. Trading may expose you to risk of loss greater than your deposits and is only suitable for experienced investors who have sufficient financial means to bear such risk.
ProRealTime ITF files and other attachments :
Find other exclusive trading pro-tools on ![]()
PRC is also on YouTube, subscribe to our channel for exclusive content and tutorials


Sorry,
Line 139 should say;
RETURN ind1 COLOURED(0, 0, 200) AS “Pocket Pivot”
When posted it would come up ” Pivot Pocket ” unless changed.
Thanks
🙂
Update Code
More accurate signals
// ———————————-
// The Pocket Pivot Indicator
//
// ver 0.1
// 0.2 – using the max volume of a down day in the past 10 days
//
// ———————————-
// Basic criteria
minPrice = 0.0001
minVol = 1000
daysToConfirmUpTrend =9
// Only scan leading stocks above minimal price and 40 day moving average of Volume is above 500000]
cVol1 = (Close >= minPrice AND Average[50](Volume) >= minVol)
// Trend is up and Today is an up day
cPrc1 = (Close >= Average[daysToConfirmUpTrend](Close) AND Close >= Close[1] )
// Today’s volume should be larger than the volume of the highest down day over the last 10 days
maxDay = 9
maxDownDay = 0
maxDown = 0
FOR d = 1 TO maxDay DO
r = Close[d] > Open[d]
IF r =maxDown THEN
maxDown = Volume[d]
maxDownDay = d
ENDIF
NEXT
IF maxDownDay = 0 THEN
maxDownDayVol = 0
ELSE
maxDownDayVol = Volume[maxDownDay]
ENDIF
cVol2 = (Volume > maxDownDayVol)
// draw indicator
ind1 = (cPrc1 AND cVol1 AND cVol2 )
RETURN ind1 COLOURED(0, 0, 200) AS “Pocket Pivot Mod 9 Day “
Hi, is there Crypto Version, forex version? thank you