Introduction
The Pollan indicator is an advanced technical tool designed to provide buy and sell signals based on the combination of two popular technical analysis indicators: the Commodity Channel Index (CCI) and the Relative Strength Index (RSI).
The main goal of the Pollan indicator is to identify key moments when the market shows overbought or oversold conditions and combine these signals with an adjusted moving average to improve the accuracy of market entries and exits.
Throughout this article, we will explore in detail how the Pollan indicator works, how to configure it, and how to interpret its signals to enhance your trading strategies.
Description of the Pollan Indicator
The Pollan indicator combines the calculations of the Commodity Channel Index (CCI) and the Relative Strength Index (RSI) to generate more accurate trading signals. Below is a detailed description of how the key components of the indicator are calculated.
Indicator Components
- Commodity Channel Index (CCI):
- The CCI measures the variation of the current price relative to an average price over a specific period. A high CCI value indicates that the price is well above the average, while a low value indicates it is well below.
- In the Pollan indicator, the CCI period is configurable and is denoted as CCIper.
- Relative Strength Index (RSI):
- The RSI is an oscillator that measures the speed and change of price movements. It is used to identify overbought or oversold conditions in the market.
- The RSI period is also configurable and is denoted as RSIper.
- Moving Average (MA):
- A moving average is used to smooth the differences calculated between the CCI and RSI, providing a more stable signal.
- The moving average period is configured using the MaPeriod parameter.
Calculation of CCI-RSI Differences
The core of the Pollan indicator is based on calculating the differences between the CCI and RSI at several historical points, adjusted according to the coefficient (koef). These differences are calculated as follows:
- The difference between the CCI and RSI is calculated for the current period and several previous periods, up to a maximum of 8 periods.
- A similar operation is performed but inverting the difference (RSI – CCI).
Use of Coefficients
The coefficient (koef) is a key parameter that determines how many historical periods will be considered in the calculations. This coefficient can take values from 0 to 8, and according to its value, the sums of the calculated differences are adjusted.
Example of difference calculation:
- For koef = 8, the differences from the current period to 8 periods ago are summed.
- For koef = 7, the differences from 1 period ago to 8 periods ago are summed.
- For koef = 6, the differences from 2 periods ago to 8 periods ago are summed.
- For koef = 4, the differences from 4 periods ago to 8 periods ago are summed.
- For koef = 0, only the difference between CCI and RSI from 8 periods ago is considered.
Summary of Calculations
- Calculated Differences:
- a and b represent the CCI-RSI and RSI-CCI differences, respectively, calculated for multiple periods.
- The sums of these differences are adjusted according to the value of koef.
- Moving Average:
- A moving average is applied to the adjusted sums of the differences (tt1max and tt2min), producing the values Diff1 and Diff2.
- Generation of Trading Signals:
- Buy signals are generated when Diff1 crosses above Diff2, and sell signals are generated when Diff1 crosses below Diff2.
Configuring the Indicator
The Pollan indicator can be configured with several parameters to adapt it to different market conditions and trader preferences. Below are the configurable parameters and their impact on the indicator’s behavior.
Configurable Parameters
- CCI Period (CCIper):
- Defines the number of periods used to calculate the Commodity Channel Index (CCI).
- Default value: 14.
- Example: CCIper = 20 will use a 20-period CCI.
- RSI Period (RSIper):
- Defines the number of periods used to calculate the Relative Strength Index (RSI).
- Default value: 14.
- Example: RSIper = 10 will use a 10-period RSI.
- Moving Average Period (MaPeriod):
- Defines the number of periods for the moving average used to smooth the differences between the CCI and RSI.
- Default value: 2.
- Example: MaPeriod = 5 will apply a 5-period moving average to the calculated differences.
- Coefficient (koef):
- Determines how many historical periods will be considered in the calculations of the differences between the CCI and RSI.
- Default value: 8.
- Example: koef = 4 will consider the differences from 4 periods ago to 8 periods ago in the calculations.
Impact of Configuration on Pollan Indicator Behavior
- CCI and RSI Period:
- Changing the periods of the CCI and RSI will affect the indicator’s sensitivity to price changes. Shorter periods will make the indicator react more quickly to market fluctuations, while longer periods will make it smoother and less reactive.
- Moving Average Period:
- A shorter moving average period will make buy and sell signals more frequent but less reliable, while a longer period will smooth the differences and reduce the number of signals generated.
- Coefficient:
- Adjusting the coefficient will determine how many historical periods are considered in the calculation of the differences. A higher value will consider more historical data, providing a broader context but potentially being less reactive to recent changes.
How the Indicator Works
The Pollan indicator uses a combination of calculations based on the CCI and RSI to generate buy and sell signals. Below is a step-by-step description of the calculation process and the logic for generating signals.
Calculation Description Step by Step
- Variable Initialization:
- Periods for CCI, RSI, moving average, and the coefficient are defined.
- i is initialized with the value 8, which is used to calculate historical differences.
- Calculation of CCI-RSI Differences:
- Differences between the CCI and RSI are calculated for the current period and several previous periods.
Calculation example:
|
1 2 |
a = cci[CCIper](typicalprice)[i] - rsi[RSIper](typicalprice)[i] a1 = cci[CCIper](typicalprice)[i-1] - rsi[RSIper](typicalprice)[i+1] |
- Calculation of RSI-CCI Differences:
- Similar to the previous step, but inverting the calculation.
Calculation example:
|
1 2 |
b = rsi[RSIper](typicalprice)[i] - cci[CCIper](typicalprice)[i] b1 = rsi[RSIper](typicalprice)[i-1] - cci[CCIper](typicalprice)[i+1] |
- Application of the Coefficient:
- Different sums of the calculated differences are used according to the value of the coefficient.
Example of coefficient application:
|
1 2 3 4 5 6 7 8 9 10 11 12 13 14 15 16 17 18 19 20 21 22 23 24 25 26 27 28 |
if koef >= 8 then tt1max = a + a1 + a2 + a3 + a4 + a5 + a6 + a7 + a8 tt2min = b + b1 + b2 + b3 + b4 + b5 + b6 + b7 + b8 elsif koef = 7 then tt1max = a + a1 + a2 + a3 + a4 + a5 + a6 + a7 tt2min = b + b1 + b2 + b3 + b4 + b5 + b6 + b7 elsif koef = 6 then tt1max = a + a1 + a2 + a3 + a4 + a5 + a6 tt2min = b + b1 + b2 + b3 + b4 + b5 + b6 elsif koef = 5 then tt1max = a + a1 + a2 + a3 + a4 + a5 tt2min = b + b1 + b2 + b3 + b4 + b5 elsif koef = 4 then tt1max = a + a1 + a2 + a3 + a4 tt2min = b + b1 + b2 + b3 + b4 elsif koef = 3 then tt1max = a + a1 + a2 + a3 tt2min = b + b1 + b2 + b3 elsif koef = 2 then tt1max = a + a1 + a2 tt2min = b + b1 + b2 elsif koef = 1 then tt1max = a + a1 tt2min = b + b1 elsif koef = 0 then tt1max = a tt2min = b endif |
- Moving Average Calculation:
- A moving average is applied to the adjusted sums of the differences (tt1max and tt2min).
Example:
|
1 2 |
Diff1 = average[MaPeriod](tt1max) Diff2 = average[MaPeriod](tt2min) |
- Generation of Trading Signals:
- Buy and sell signals are generated based on the crossings of the calculated moving averages.
Example:
|
1 2 3 4 5 |
if Diff1 >= Diff2 and Diff1[1] < Diff2[1] then drawarrowup(barindex, Diff1) coloured("green") elsif Diff1 <= Diff2 and Diff1[1] > Diff2[1] then drawarrowdown(barindex, Diff1) coloured("red") endif |
Interpretation of the Indicator
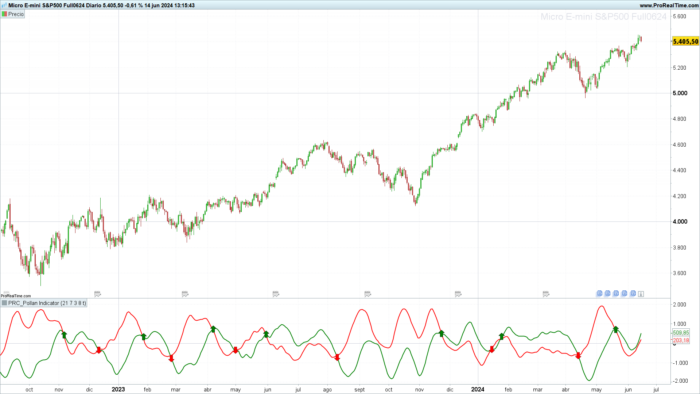
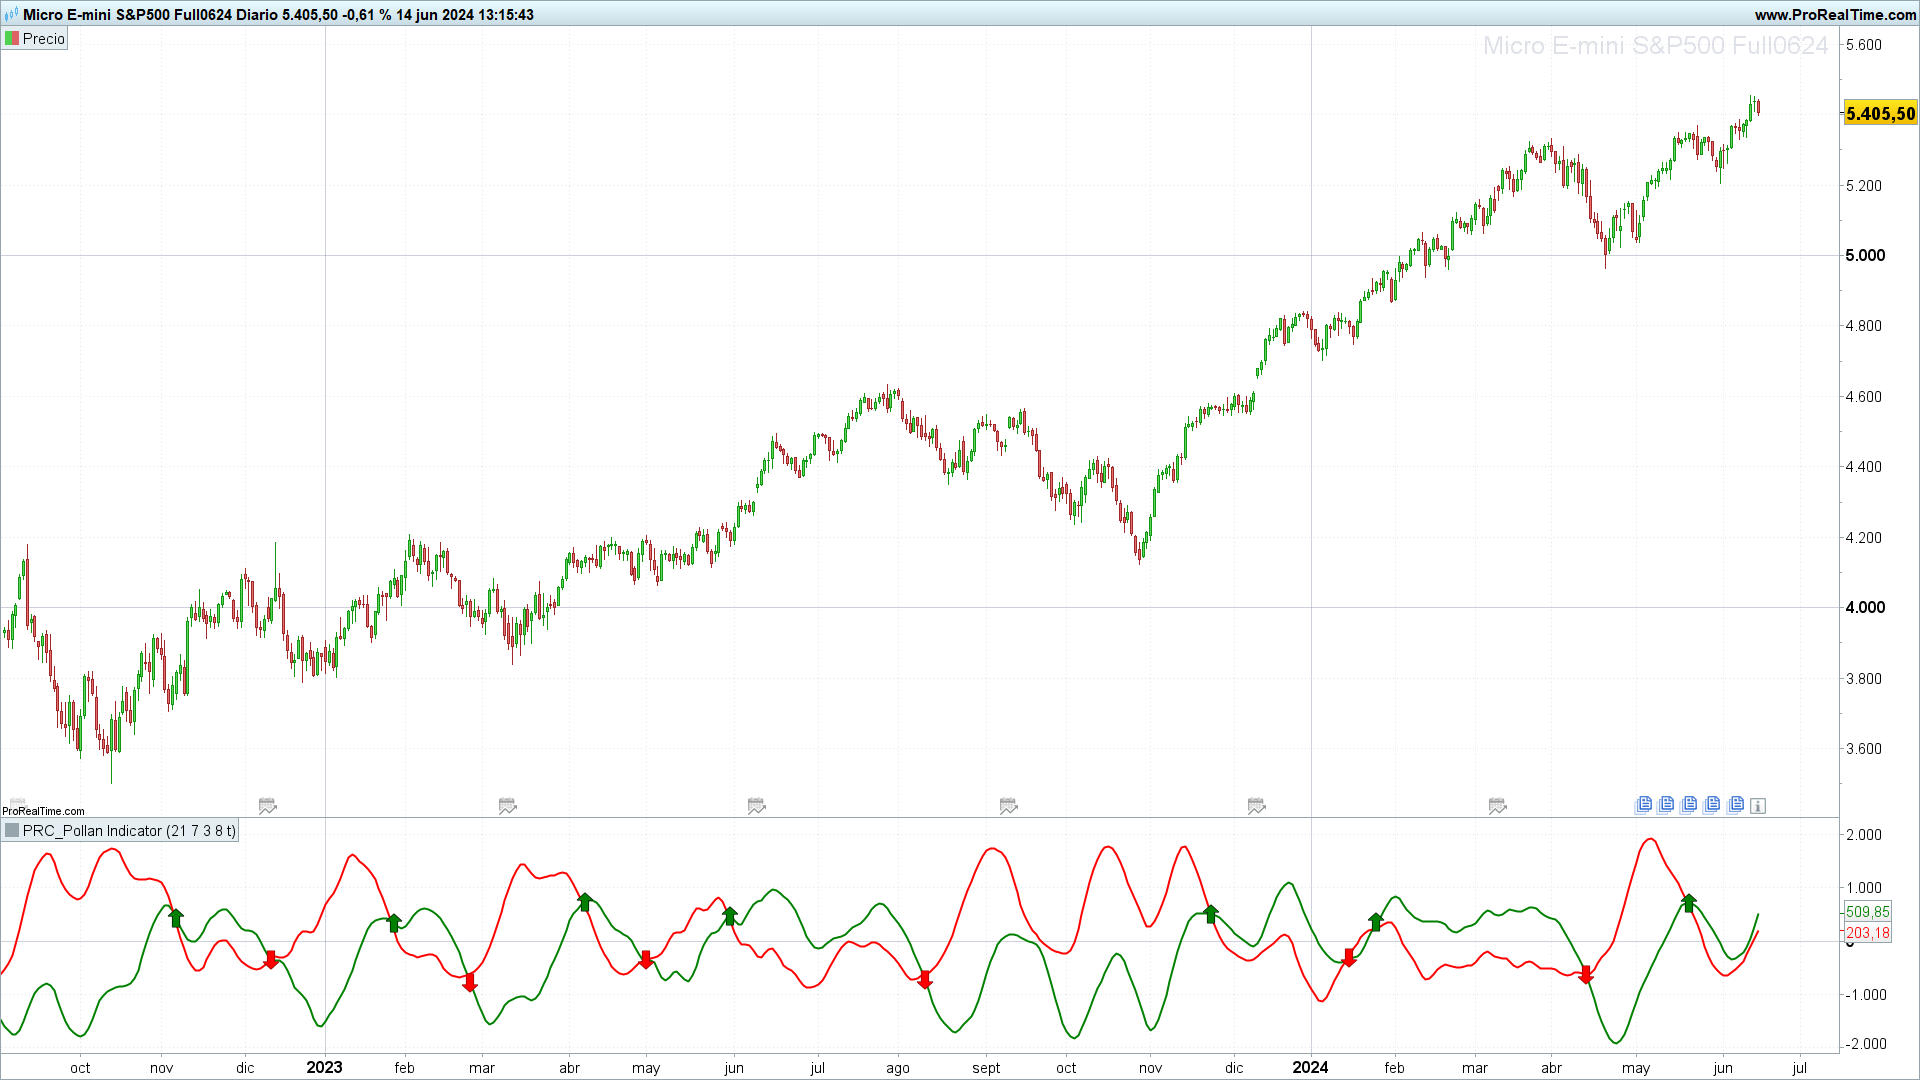
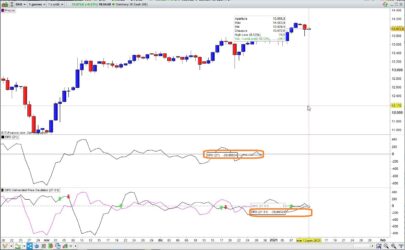
The Pollan indicator provides visual signals on the chart using arrows that indicate possible buy and sell moments. Below is an explanation of how to interpret these signals and how to use them to enhance your trading strategies.
Buy and Sell Signals
- Buy Signals:
- A green upward arrow is drawn on the chart when Diff1 crosses above Diff2.
- This signal suggests a potential entry point for a long position (buy).
- The logic behind this signal is that the calculated difference between the CCI and RSI suggests a change in market direction, indicating a possible upward movement.
- Sell Signals:
- A red downward arrow is drawn on the chart when Diff1 crosses below Diff2.
- This signal suggests a potential entry point for a short position (sell).
- The logic behind this signal is that the calculated difference between the CCI and RSI suggests a change in market direction, indicating a possible downward movement.
Practical Use of the Indicator
- Signal Confirmation:
- It is recommended to use the Pollan indicator in conjunction with other technical indicators to confirm buy and sell signals. For example, you can combine it with longer-term moving averages, volume indicators, or candlestick pattern analysis.
- Parameter Adjustment:
- Depending on your trading strategy and the asset you are analyzing, you can adjust the indicator parameters (CCIper, RSIper, MaPeriod, and koef) to optimize its performance.
- Perform backtesting to evaluate how different settings affect the accuracy of the signals.
- Risk Management:
- Consider market volatility and adjust your positions accordingly.
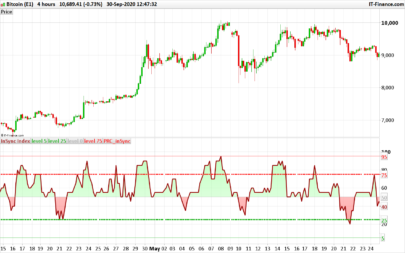
Visual Example
In the chart, green arrows indicate suggested entry points for long positions, while red arrows indicate suggested entry points for short positions. The colored lines show the moving averages of the calculated differences (Diff1 in green and Diff2 in red).
Conclusion
The Pollan indicator is a powerful tool that combines two popular technical indicators, the CCI and RSI, to generate more accurate trading signals. By adjusting the indicator parameters and using it in combination with other technical analysis tools, traders can improve their market entry and exit strategies.
Pollan Indicator Code
|
1 2 3 4 5 6 7 8 9 10 11 12 13 14 15 16 17 18 19 20 21 22 23 24 25 26 27 28 29 30 31 32 33 34 35 36 37 38 39 40 41 42 43 44 45 46 47 48 49 50 51 52 53 54 55 56 57 58 59 60 61 62 63 64 65 66 67 68 69 70 71 72 73 74 75 76 77 78 79 80 81 |
//---------------------------------------------------------------// //PRC_Pollan Indicator //version = 0 //06.05.24 //Iván González @ www.prorealcode.com //Sharing ProRealTime knowledge //---------------------------------------------------------------// //-----Inputs----------------------------------------------------// CCIper = 14 RSIper = 14 MaPeriod = 2 koef = 8 showarrows = 1 //---------------------------------------------------------------// //-----Components Calculation------------------------------------// i=8 //---Diff. CCI-RSI a=cci[CCIper](typicalprice)[i]-rsi[rsiper](typicalprice)[i] a1=cci[CCIper](typicalprice)[i-1]-rsi[rsiper](typicalprice)[i+1] a2=cci[CCIper](typicalprice)[i-2]-rsi[rsiper](typicalprice)[i+2] a3=cci[CCIper](typicalprice)[i-3]-rsi[rsiper](typicalprice)[i+3] a4=cci[CCIper](typicalprice)[i-4]-rsi[rsiper](typicalprice)[i+4] a5=cci[CCIper](typicalprice)[i-5]-rsi[rsiper](typicalprice)[i+5] a6=cci[CCIper](typicalprice)[i-6]-rsi[rsiper](typicalprice)[i+6] a7=cci[CCIper](typicalprice)[i-7]-rsi[rsiper](typicalprice)[i+7] a8=cci[CCIper](typicalprice)[i-8]-rsi[rsiper](typicalprice)[i+8] //---Diff. RSI-CCI b=rsi[rsiper](typicalprice)[i]-cci[CCIper](typicalprice)[i] b1=rsi[rsiper](typicalprice)[i-1]-cci[CCIper](typicalprice)[i+1] b2=rsi[rsiper](typicalprice)[i-2]-cci[CCIper](typicalprice)[i+2] b3=rsi[rsiper](typicalprice)[i-3]-cci[CCIper](typicalprice)[i+3] b4=rsi[rsiper](typicalprice)[i-4]-cci[CCIper](typicalprice)[i+4] b5=rsi[rsiper](typicalprice)[i-5]-cci[CCIper](typicalprice)[i+5] b6=rsi[rsiper](typicalprice)[i-6]-cci[CCIper](typicalprice)[i+6] b7=rsi[rsiper](typicalprice)[i-7]-cci[CCIper](typicalprice)[i+7] b8=rsi[rsiper](typicalprice)[i-8]-cci[CCIper](typicalprice)[i+8] //---------------------------------------------------------------// //-----Switch Koef-----------------------------------------------// if koef >=8 then tt1max = a+a1+a2+a3+a4+a5+a6+a7+a8 tt2min = b+b1+b2+b3+b4+b5+b6+b7+b8 elsif koef = 7 then tt1max = a+a1+a2+a3+a4+a5+a6+a7 tt2min = b+b1+b2+b3+b4+b5+b6+b7 elsif koef = 6 then tt1max = a+a1+a2+a3+a4+a5+a6 tt2min = b+b1+b2+b3+b4+b5+b6 elsif koef = 5 then tt1max = a+a1+a2+a3+a4+a5 tt2min = b+b1+b2+b3+b4+b5 elsif koef = 4 then tt1max = a+a1+a2+a3+a4 tt2min = b+b1+b2+b3+b4 elsif koef = 3 then tt1max = a+a1+a2+a3 tt2min = b+b1+b2+b3 elsif koef = 2 then tt1max = a+a1+a2 tt2min = b+b1+b2 elsif koef = 1 then tt1max = a+a1 tt2min = b+b1 elsif koef = 0 then tt1max = a tt2min = b endif //---------------------------------------------------------------// //---------------------------------------------------------------// Diff1 = average[maperiod](tt1max) Diff2 = average[maperiod](tt2min) //---------------------------------------------------------------// //---------------------------------------------------------------// if showarrows then if Diff1 >= Diff2 and Diff1[1] < Diff2[1] then drawarrowup(barindex,Diff1)coloured("green") elsif Diff1 <= Diff2 and Diff1[1] > Diff2[1] then drawarrowdown(barindex,Diff1)coloured("red") endif endif //---------------------------------------------------------------// return Diff1 coloured("green")style(line,2), Diff2 coloured("red")style(line,2) |
Share this
No information on this site is investment advice or a solicitation to buy or sell any financial instrument. Past performance is not indicative of future results. Trading may expose you to risk of loss greater than your deposits and is only suitable for experienced investors who have sufficient financial means to bear such risk.
ProRealTime ITF files and other attachments :
Find other exclusive trading pro-tools on ![]()
PRC is also on YouTube, subscribe to our channel for exclusive content and tutorials


Congratulations on this work !
I have a problem that I don’t understand: by changing the parameters of the CCI and RSI periods, as well as the other two, the graph remains the same and the entry and exit signals, too. Both on version 12 and 11.
Then I find this indicator not very reactive and lagging behind the moving averages alone, for example.
Thank’s for your job!
Hi! Sorry… You have to check lines 9 to 13 and delete.
//CCIper = 14
//RSIper = 14
//MaPeriod = 2
//koef = 8
//showarrows = 1
grazie Ivàn!
Thank you. Is it possible to convert this to a screener that displays instruments when bullish/bearish crossover occurs?
//—————————————————————//
//PRC_Pollan Indicator
//version = 0
//06.05.24
//Iván González @ http://www.prorealcode.com
//Sharing ProRealTime knowledge
//—————————————————————//
//—–Inputs—————————————————-//
CCIper = 14
RSIper = 14
MaPeriod = 2
koef = 8
showarrows = 1
//—————————————————————//
//—–Components Calculation————————————//
i=8
//—Diff. CCI-RSI
a=cci[CCIper](typicalprice)[i]-rsi[rsiper](typicalprice)[i]
a1=cci[CCIper](typicalprice)[i-1]-rsi[rsiper](typicalprice)[i+1]
a2=cci[CCIper](typicalprice)[i-2]-rsi[rsiper](typicalprice)[i+2]
a3=cci[CCIper](typicalprice)[i-3]-rsi[rsiper](typicalprice)[i+3]
a4=cci[CCIper](typicalprice)[i-4]-rsi[rsiper](typicalprice)[i+4]
a5=cci[CCIper](typicalprice)[i-5]-rsi[rsiper](typicalprice)[i+5]
a6=cci[CCIper](typicalprice)[i-6]-rsi[rsiper](typicalprice)[i+6]
a7=cci[CCIper](typicalprice)[i-7]-rsi[rsiper](typicalprice)[i+7]
a8=cci[CCIper](typicalprice)[i-8]-rsi[rsiper](typicalprice)[i+8]
//—Diff. RSI-CCI
b=rsi[rsiper](typicalprice)[i]-cci[CCIper](typicalprice)[i]
b1=rsi[rsiper](typicalprice)[i-1]-cci[CCIper](typicalprice)[i+1]
b2=rsi[rsiper](typicalprice)[i-2]-cci[CCIper](typicalprice)[i+2]
b3=rsi[rsiper](typicalprice)[i-3]-cci[CCIper](typicalprice)[i+3]
b4=rsi[rsiper](typicalprice)[i-4]-cci[CCIper](typicalprice)[i+4]
b5=rsi[rsiper](typicalprice)[i-5]-cci[CCIper](typicalprice)[i+5]
b6=rsi[rsiper](typicalprice)[i-6]-cci[CCIper](typicalprice)[i+6]
b7=rsi[rsiper](typicalprice)[i-7]-cci[CCIper](typicalprice)[i+7]
b8=rsi[rsiper](typicalprice)[i-8]-cci[CCIper](typicalprice)[i+8]
//—————————————————————//
//—–Switch Koef———————————————–//
if koef >=8 then
tt1max = a+a1+a2+a3+a4+a5+a6+a7+a8
tt2min = b+b1+b2+b3+b4+b5+b6+b7+b8
elsif koef = 7 then
tt1max = a+a1+a2+a3+a4+a5+a6+a7
tt2min = b+b1+b2+b3+b4+b5+b6+b7
elsif koef = 6 then
tt1max = a+a1+a2+a3+a4+a5+a6
tt2min = b+b1+b2+b3+b4+b5+b6
elsif koef = 5 then
tt1max = a+a1+a2+a3+a4+a5
tt2min = b+b1+b2+b3+b4+b5
elsif koef = 4 then
tt1max = a+a1+a2+a3+a4
tt2min = b+b1+b2+b3+b4
elsif koef = 3 then
tt1max = a+a1+a2+a3
tt2min = b+b1+b2+b3
elsif koef = 2 then
tt1max = a+a1+a2
tt2min = b+b1+b2
elsif koef = 1 then
tt1max = a+a1
tt2min = b+b1
elsif koef = 0 then
tt1max = a
tt2min = b
endif
//—————————————————————//
//—————————————————————//
Diff1 = average[maperiod](tt1max)
Diff2 = average[maperiod](tt2min)
//—————————————————————//
//—————————————————————//
if showarrows then
if Diff1 >= Diff2 and Diff1[1] < Diff2[1] then
arrowUp=1
arrowDw=0
elsif Diff1 Diff2[1] then
arrowDw=1
arrowUp=0
else
arrowUp=0
arrowDw=0
endif
endif
//—————————————————————//
screener[arrowUp or arrowDw](arrowUP as “Long”,arrowDw as “Short”)