This indicator follows Trend Action, it is an improved version although the other one is still recent.
The changes made are the method of calculation, which is intended to be simpler and more relevant.
ITF provided :
– “Price Action” applied in secondary.
– “Bubbles” for the simplified Price Action also in secondary
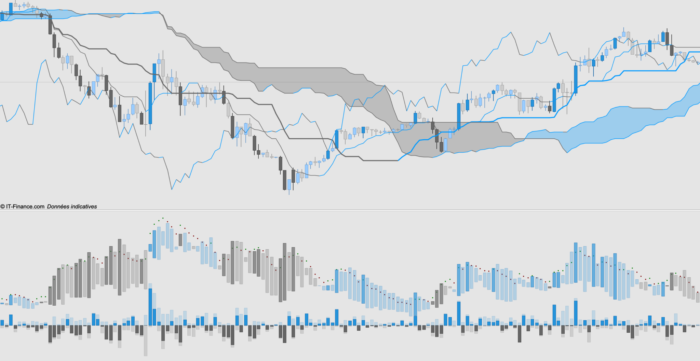
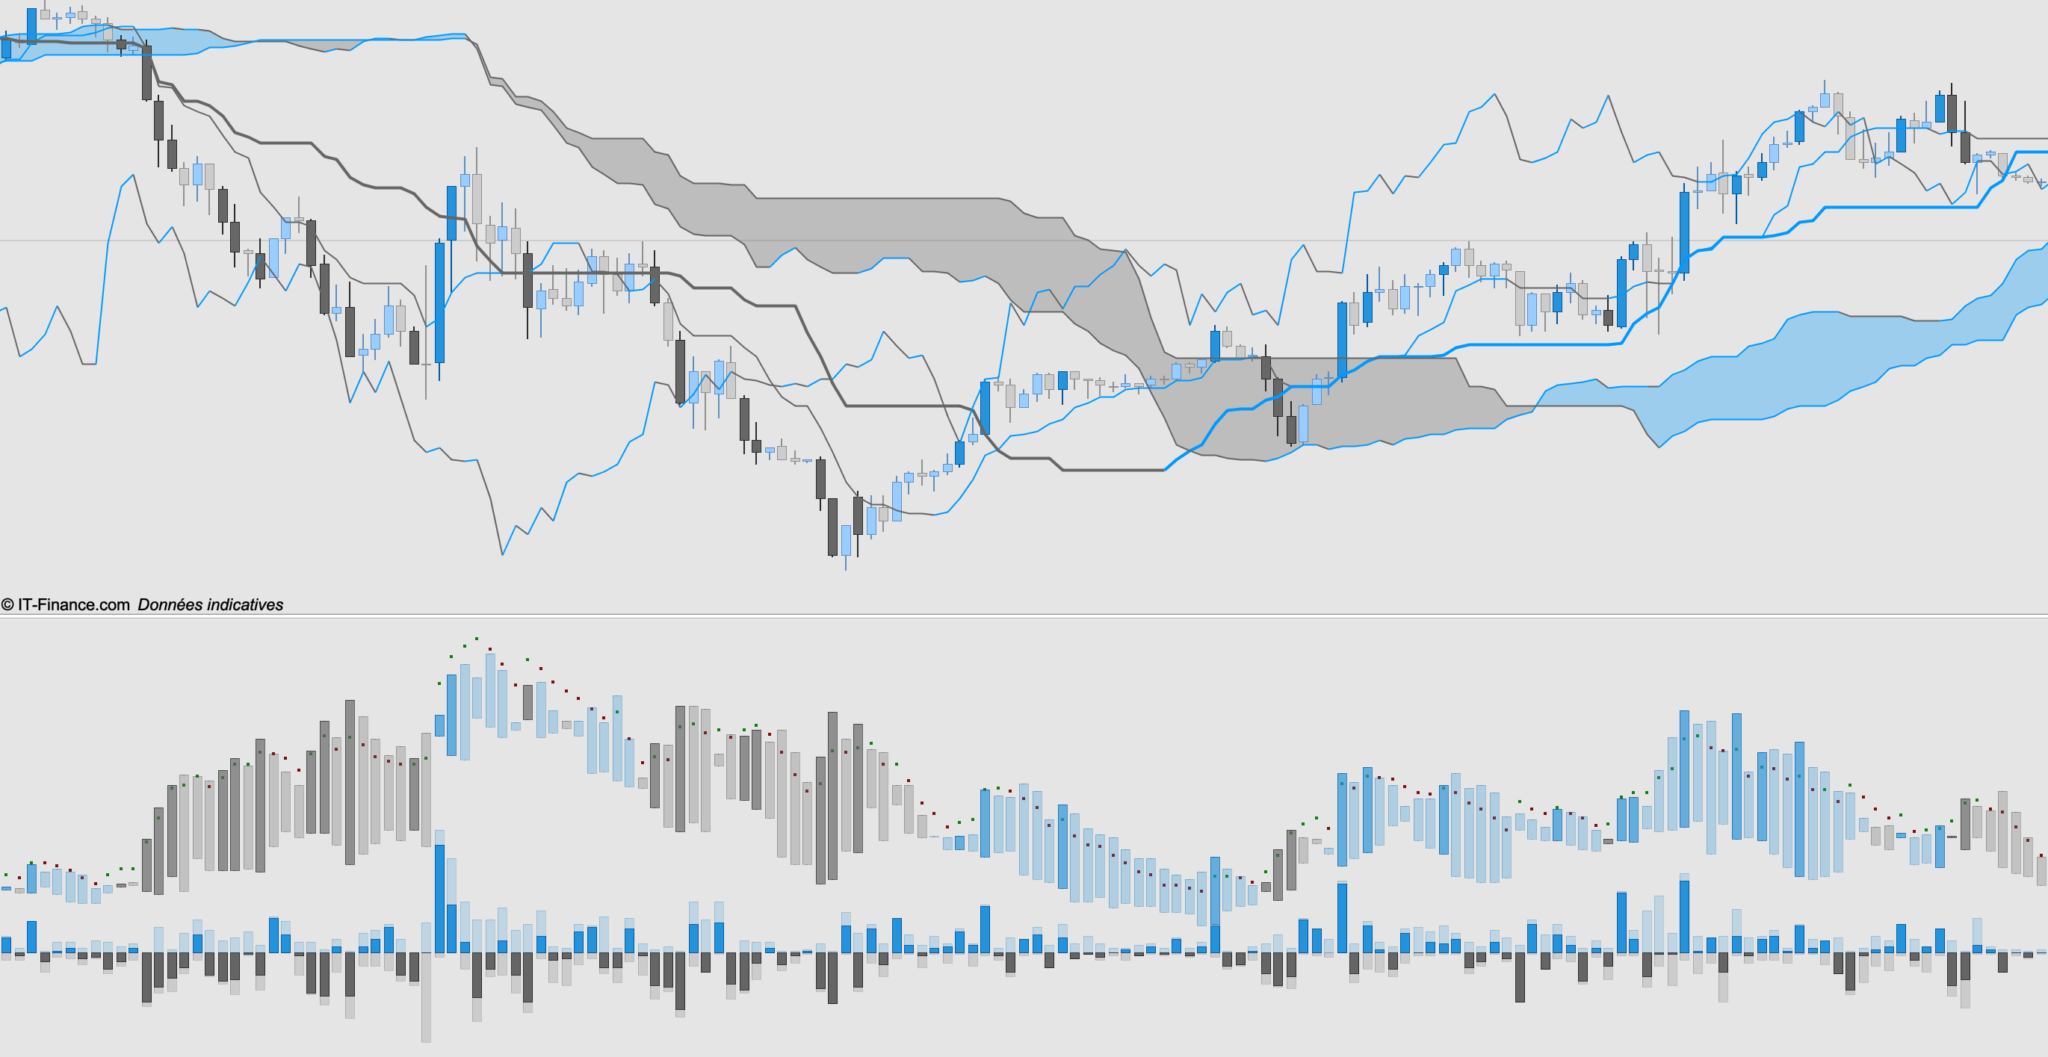
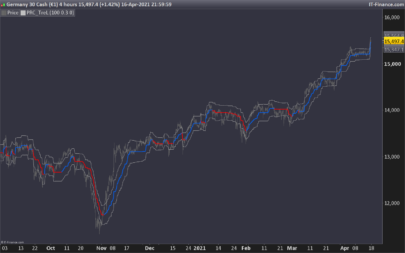
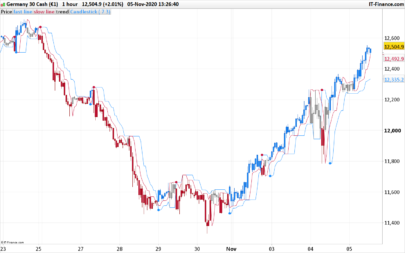
– “Candlestick Action” applied on the graph, it translates the impulses given by the Price Action indicator.
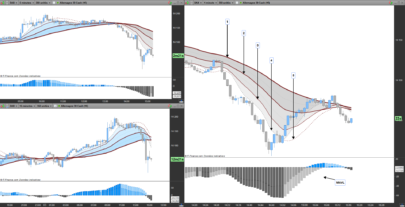
The Price Action indicator is composed of several candlesticks, the dark candlesticks represent the amplitude of the body of the candle, the light candlestick translates the amplitude of the wicks by giving their sense of dominance.
An average of the last 5 and 15 periods and apply to the body of the candles bullish then bearish, the same method and then calculate on the wicks of the candles to give two lines of force, either bullish or bearish depending on the configuration of the candles.
The construction of these averages gives the Bubble, which gives the direction and amplitude of the movement over a standard deviation of 1
The Bubble gives another information, when the candlestick becomes darker, it translates an impulse of the candle in court, which can be carefully considered as a point of entry, this information is also given by the visible line of strength in red and green dots, red translates a weakness, green a strength.
For easier reading, you can apply the Candlestick Action indicator on the price to see the impulses directly.
It is obvious that an indicator in no way cancels the possibility of losing, therefore, to be used with a warning, an indicator is used with a strategy, this indicator gives you information, it is up to you to develop a plan.
Yours sincerely,
IV
|
1 2 3 4 5 6 7 8 9 10 11 12 13 14 15 16 17 18 19 20 21 22 23 24 25 26 27 28 29 30 31 32 33 34 35 36 37 38 39 40 41 42 43 44 45 46 47 48 49 50 51 52 53 54 55 56 57 58 59 60 61 62 63 64 65 66 67 68 69 70 71 72 73 74 75 76 77 78 79 80 81 82 83 84 85 86 87 88 89 90 91 92 93 94 95 96 97 98 99 100 101 102 103 104 105 106 107 108 109 110 111 112 113 114 115 116 117 118 119 120 121 122 123 124 125 126 127 128 129 130 131 132 133 134 135 136 137 138 139 140 141 142 143 144 145 146 147 148 149 150 151 152 153 154 155 156 |
// //============================== Trend haussier //Configuration haussière if (close > open) then UP = 1 else UP = 0 endif //Valeurs des configuration haussière if (UP = 1) then VHCORP = 0 + (close - open) VHMECH = VHCORP + (open - low) VHBMECH = 0 - (high - close) elsif (UP = 0) then VHCORP = 0 VHMECH = 0 VHBMECH = 0 endif //Valeurs moyenne des corps haussier VMHCORP1 = summation[5] (VHCORP) VMHCORP2 = summation[15] (VHCORP) VMHCORP = (VMHCORP1 + VMHCORP2) / 2 //Valeurs moyenne des mèches haussière VMHMECH1 = summation[5] (VHMECH + VBHMECH + VNHMECH) VMHMECH2 = summation[15] (VHMECH + VBHMECH + VNHMECH) VMHMECH = (VMHMECH1 + VMHMECH2) / 2 //Valeurs des moyenne haussière VMH = (VMHCORP + VMHMECH) / 2 //============================== Trend baissier //Configuration baissière if (close < open) then DW = 1 else DW = 0 endif //Valeurs des configuration baissière if (DW = 1) then VBCORP = 0 - (open - close) VBMECH = VBCORP - (high - open) VBHMECH = 0 + (close - low) elsif (DW = 0) then VBCORP = 0 VBMECH = 0 VBHMECH = 0 endif //Valeurs moyenne des corps baissier VMBCORP1 = summation[5] (VBCORP) VMBCORP2 = summation[15] (VBCORP) VMBCORP = (VMBCORP1 + VMBCORP2) / 2 //Valeurs moyenne des mèches baissière VMBMECH1 = summation[5] (VBMECH + VHBMECH + VNBMECH) VMBMECH2 = summation[15] (VBMECH + VHBMECH + VNBMECH) VMBMECH = (VMBMECH1 + VMBMECH2) / 2 //Valeurs des moyenne hbaissière VMB1 = (VMBCORP + VMBMECH) / 2 VMB = (VMB1 - VMB1) - VMB1 //============================== Trend neutre //Configuration neutre if (close = open) then NT = 1 else NT = 0 endif //Valeurs des configuration neutre if (NT = 1) then VNHMECH = 0 + (open - low) VNBMECH = 0 - (high - open) elsif (NT = 0) then VNHMECH = 0 VNBMECH = 0 endif //============================== Configuration de la ligne de force //Paramettre de la force UP1 = VMH + STD[5] * 1 UP2 = VMH + STD[15] * 1 UP = (UP1 + UP2) / 2 DW1 = VMB + STD[5] * 1 DW2 = VMB + STD[15] * 1 DW = (DW1 + DW2) / 2 LDF = (UP + DW) / 2 //coloration de la ligne de force if (LDF > LDF[1]) then R = 13 G = 127 B = 13 elsif (LDF < LDF[1]) then R = 127 G = 13 B = 13 endif //============================== Configuration du nuage directionnel //Paramettre du nuage if (VMH > VMB) and (LDF < LDF[1]) then drawcandle (VMH,VMB,VMH,VMB) coloured (36,147,219,70) elsif (VMH < VMB) and (LDF < LDF[1]) then drawcandle (VMH,VMB,VMH,VMB) coloured (101,101,101,70) elsif (VMH > VMB) and (LDF > LDF[1]) and (close-open > high-close) then drawcandle (VMH,VMB,VMH,VMB) coloured (36,147,219,170) elsif (VMH < VMB) and (LDF > LDF[1]) and (open-close > close-low) then drawcandle (VMH,VMB,VMH,VMB) coloured (101,101,101,170) elsif (VMH > VMB) and (LDF > LDF[1]) and (close < open) then drawcandle (VMH,VMB,VMH,VMB) coloured (36,147,219,70) elsif (VMH < VMB) and (LDF > LDF[1]) and (close > open) then drawcandle (VMH,VMB,VMH,VMB) coloured (101,101,101,70) elsif (VMH > VMB) and (LDF > LDF[1]) and (high-close > close-open) then drawcandle (VMH,VMB,VMH,VMB) coloured (36,147,219,70) elsif (VMH < VMB) and (LDF > LDF[1]) and (close-low > open-close) then drawcandle (VMH,VMB,VMH,VMB) coloured (101,101,101,70) endif //============================== Fin return VHCORP coloured (36,147,219) style (histogram,1) as "HCorp" , VHMECH coloured (36,147,219,50) style (histogram,1) as "HMeche" , VHBMECH coloured (101,101,101,50) style (histogram,1) as "HBMeche" , VBCORP coloured (101,101,101) style (histogram,1) as "BCorp" , VBMECH coloured (101,101,101,50) style (histogram,1) as "BMeche" , VBHMECH coloured (36,147,219,50) style (histogram,1) as "BHMeche" , VNHMECH coloured (36,147,219,50) style (histogram,1) as "HMeche Doji" , VNBMECH coloured (101,101,101,50) style (histogram,1) as "BMeche Doji" , LDF coloured (R,G,B) style (point,2) as "Force" |
Share this
No information on this site is investment advice or a solicitation to buy or sell any financial instrument. Past performance is not indicative of future results. Trading may expose you to risk of loss greater than your deposits and is only suitable for experienced investors who have sufficient financial means to bear such risk.
ProRealTime ITF files and other attachments :PRC is also on YouTube, subscribe to our channel for exclusive content and tutorials




bonjour , super votre indicateur!!!!
est-il possible de l’avoir en histograme +1 /-1 por en faire ensuite un screener ? j’ai essayé mais trop compliqué pour moi