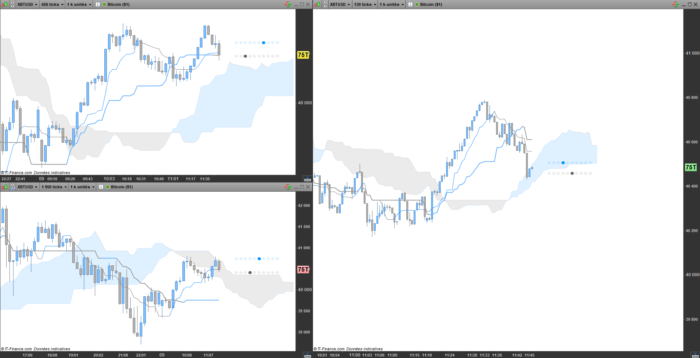
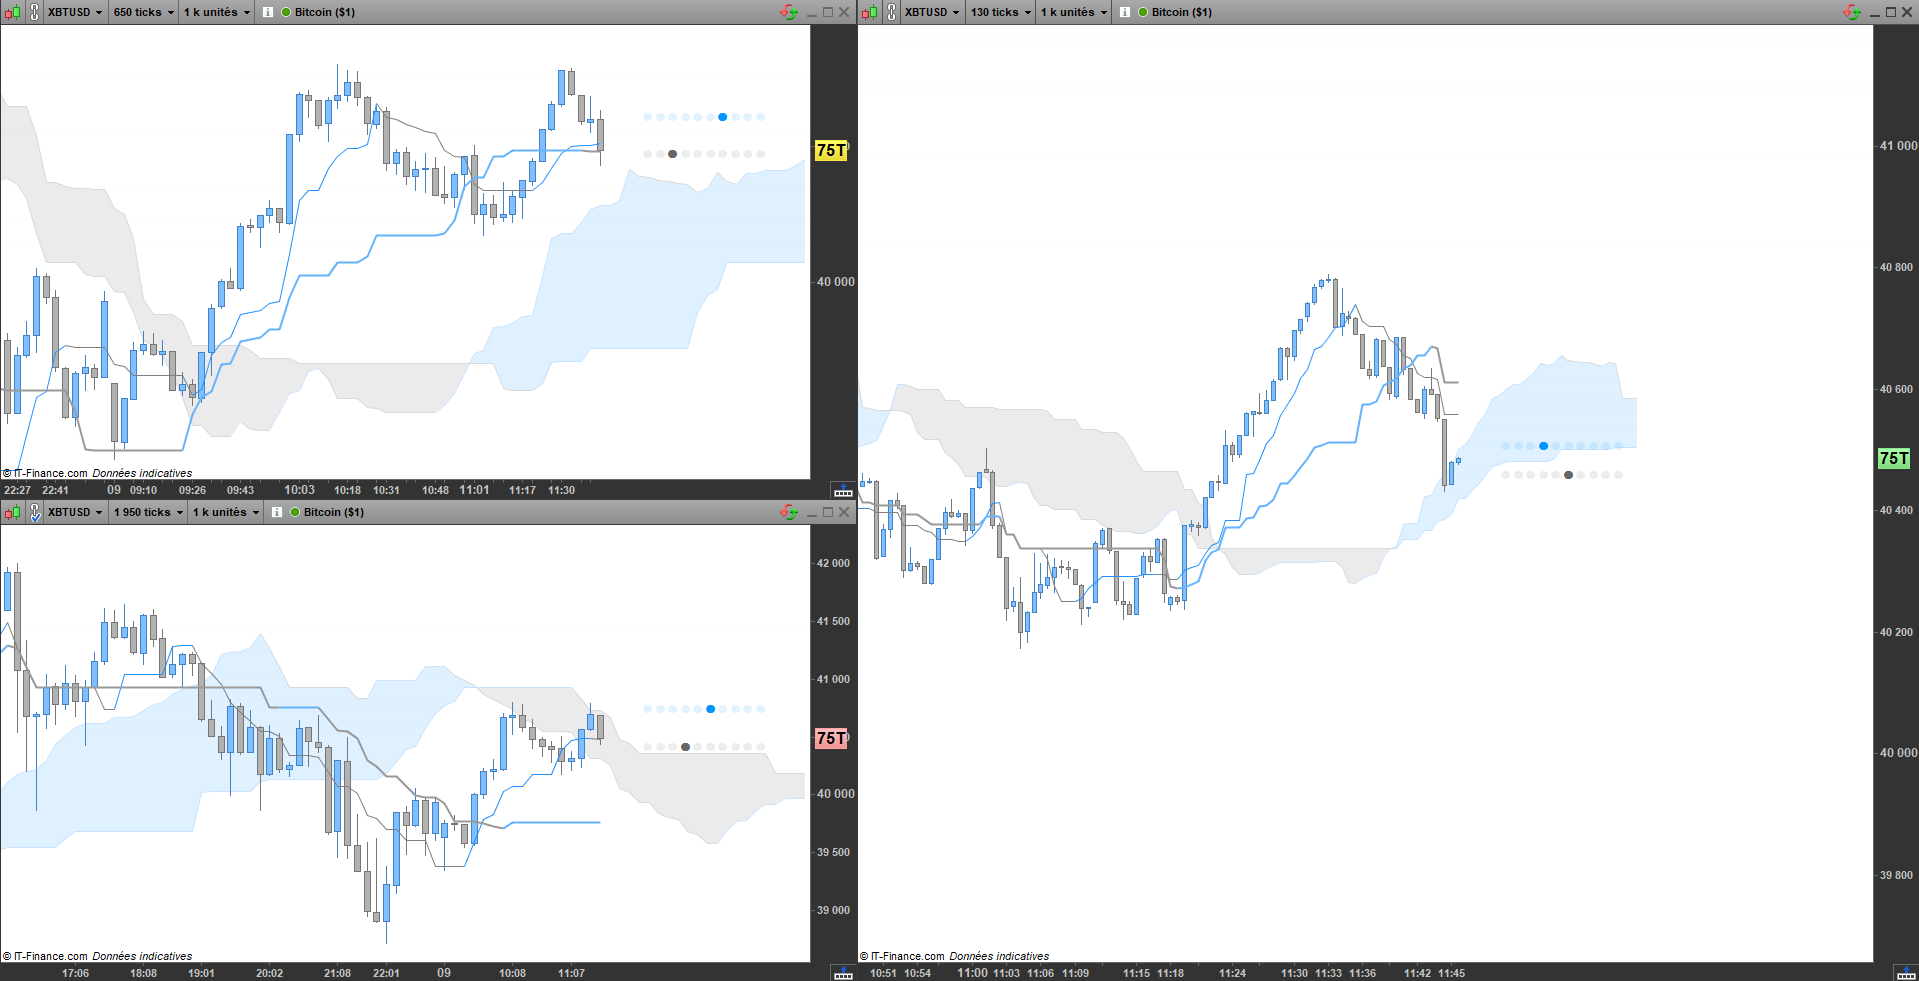
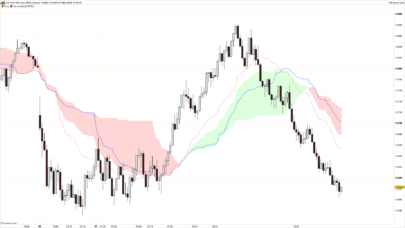
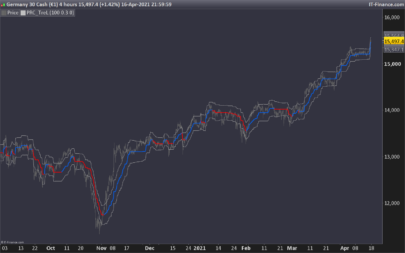
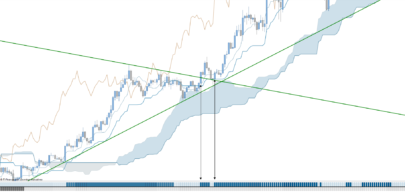
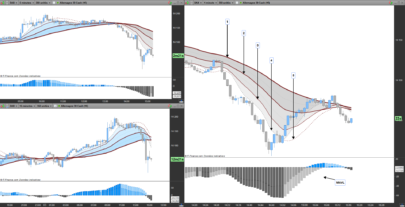
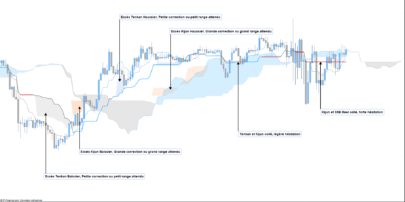
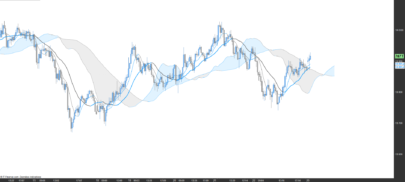
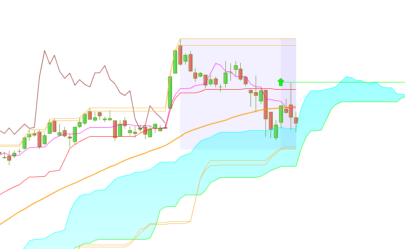
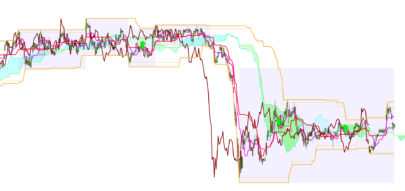
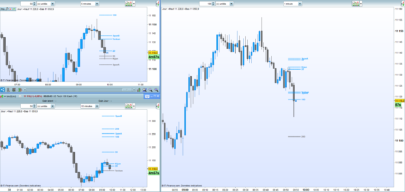
This indicator is used to gauge the direction of the price with the components of the ichimoku.
10 parameters for buying and selling are taken into account in the gauge.
1 – price <> SSA
2 – prices <> SSB
3 – prices <> Kijun
4 – prices <> Tenkan
5 – prices <> SSA [26]
6 – prices <> SSB [26]
7 – Tenkan <> Kijun
8 – prices <> Kijun [26]
9 – prices <> Tenkan [26]
10 – prices <> prices (high or low) [26]
In this way, it can be convenient to know who is holding the market on multiple time units.
This indicator is not a substitute for technical analysis, so care should be taken when using it.
IV
|
1 2 3 4 5 6 7 8 9 10 11 12 13 14 15 16 17 18 19 20 21 22 23 24 25 26 27 28 29 30 31 32 33 34 35 36 37 38 39 40 41 42 43 44 45 46 47 48 49 50 51 52 53 54 55 56 57 58 59 60 61 62 63 64 65 66 67 68 69 70 71 72 73 74 75 76 77 78 79 80 81 82 83 84 85 86 87 88 89 90 91 92 93 94 95 96 97 98 99 100 101 102 103 104 105 106 107 108 109 110 111 112 113 114 115 116 117 118 119 120 121 122 123 124 125 126 127 128 129 130 131 132 133 134 135 136 137 138 139 140 141 142 143 144 145 146 147 148 149 150 151 152 153 154 155 156 157 158 159 160 161 162 163 164 165 166 167 168 169 170 171 172 173 174 175 176 177 178 179 180 181 182 183 184 185 186 187 188 189 190 191 192 193 194 195 196 197 198 199 200 201 202 203 204 205 206 207 208 209 210 211 212 213 214 215 216 217 218 219 220 221 222 223 224 225 226 227 228 229 230 231 232 233 234 235 236 237 238 239 240 241 242 243 244 245 246 247 248 249 250 251 252 253 254 255 256 257 258 259 260 261 262 263 264 265 266 267 268 |
// //=/===============/=//=/===============/=//=/ Indicateur // //=/ Paramettre de Base defparam drawonlastbaronly = true //=/ Ichimoku CH = close SA = (TK[26]+KJ[26])/2 TK = (highest[9](high)+lowest[9](low))/2 KJ = (highest[26](high)+lowest[26](low))/2 SB = (highest[52](high[26])+lowest[52](low[26]))/2 //=/ Valeur d'écart V1 = average[9](high)-average[9](low) V2 = average[26](high)-average[26](low) V3 = average[52](high)-average[52](low) VxE = ((V1+V2+V3)/3)/2 //=/ Valeur de Centre VxC = (high+low+open+close)/4 // //=/===============/=//=/===============/=//=/ Signal Haussier // //=/ Signal de Base AxS = 0 //=/ Composante Acheteuse CA1 = close > TK CA2 = close > KJ CA3 = close > SB CA4 = close > SA CA5 = CH > TK[26] CA6 = CH > KJ[26] CA7 = CH > SB[26] CA8 = CH > SA[26] CA9 = CH > high[26] CA10 = TK => KJ //=/ Accumulation des signaux if CA1 then AxS = AxS+1 endif if CA2 then AxS = AxS+1 endif if CA3 then AxS = AxS+1 endif if CA4 then AxS = AxS+1 endif if CA5 then AxS = AxS+1 endif if CA6 then AxS = AxS+1 endif if CA7 then AxS = AxS+1 endif if CA8 then AxS = AxS+1 endif if CA9 then AxS = AxS+1 endif if CA10 then AxS = AxS+1 endif //=/ Affichage Visuel if AxS = 1 then drawtext(" •",barindex,VxC+VxE,dialog,bold,19) coloured(0,150,255) else drawtext(" •",barindex,VxC+VxE,dialog,bold,19) coloured(0,150,255,30) endif if AxS = 2 then drawtext(" •",barindex,VxC+VxE,dialog,bold,19) coloured(0,150,255) else drawtext(" •",barindex,VxC+VxE,dialog,bold,19) coloured(0,150,255,30) endif if AxS = 3 then drawtext(" •",barindex,VxC+VxE,dialog,bold,19) coloured(0,150,255) else drawtext(" •",barindex,VxC+VxE,dialog,bold,19) coloured(0,150,255,30) endif if AxS = 4 then drawtext(" •",barindex,VxC+VxE,dialog,bold,19) coloured(0,150,255) else drawtext(" •",barindex,VxC+VxE,dialog,bold,19) coloured(0,150,255,30) endif if AxS = 5 then drawtext(" •",barindex,VxC+VxE,dialog,bold,19) coloured(0,150,255) else drawtext(" •",barindex,VxC+VxE,dialog,bold,19) coloured(0,150,255,30) endif if AxS = 6 then drawtext(" •",barindex,VxC+VxE,dialog,bold,19) coloured(0,150,255) else drawtext(" •",barindex,VxC+VxE,dialog,bold,19) coloured(0,150,255,30) endif if AxS = 7 then drawtext(" •",barindex,VxC+VxE,dialog,bold,19) coloured(0,150,255) else drawtext(" •",barindex,VxC+VxE,dialog,bold,19) coloured(0,150,255,30) endif if AxS = 8 then drawtext(" •",barindex,VxC+VxE,dialog,bold,19) coloured(0,150,255) else drawtext(" •",barindex,VxC+VxE,dialog,bold,19) coloured(0,150,255,30) endif if AxS = 9 then drawtext(" •",barindex,VxC+VxE,dialog,bold,19) coloured(0,150,255) else drawtext(" •",barindex,VxC+VxE,dialog,bold,19) coloured(0,150,255,30) endif if AxS = 10 then drawtext(" •",barindex,VxC+VxE,dialog,bold,19) coloured(0,150,255) else drawtext(" •",barindex,VxC+VxE,dialog,bold,19) coloured(0,150,255,30) endif // //=/===============/=//=/===============/=//=/ Signal Baissier // //=/ Signal de Base VxS = 0 //=/ Composante Acheteuse CV1 = close < TK CV2 = close < KJ CV3 = close < SB CV4 = close < SA CV5 = CH < TK[26] CV6 = CH < KJ[26] CV7 = CH < SB[26] CV8 = CH < SA[26] CV9 = CH < high[26] CV10 = TK =< KJ //=/ Accumulation des signaux if CV1 then VxS = VxS-1 endif if CV2 then VxS = VxS-1 endif if CV3 then VxS = VxS-1 endif if CV4 then VxS = VxS-1 endif if CV5 then VxS = VxS-1 endif if CV6 then VxS = VxS-1 endif if CV7 then VxS = VxS-1 endif if CV8 then VxS = VxS-1 endif if CV9 then VxS = VxS-1 endif if CV10 then VxS = VxS-1 endif //=/ Affichage Visuel if VxS = -1 then drawtext(" •",barindex,VxC-VxE,dialog,bold,19) coloured(102,102,102) else drawtext(" •",barindex,VxC-VxE,dialog,bold,19) coloured(102,102,102,30) endif if VxS = -2 then drawtext(" •",barindex,VxC-VxE,dialog,bold,19) coloured(102,102,102) else drawtext(" •",barindex,VxC-VxE,dialog,bold,19) coloured(102,102,102,30) endif if VxS = -3 then drawtext(" •",barindex,VxC-VxE,dialog,bold,19) coloured(102,102,102) else drawtext(" •",barindex,VxC-VxE,dialog,bold,19) coloured(102,102,102,30) endif if VxS = -4 then drawtext(" •",barindex,VxC-VxE,dialog,bold,19) coloured(102,102,102) else drawtext(" •",barindex,VxC-VxE,dialog,bold,19) coloured(102,102,102,30) endif if VxS = -5 then drawtext(" •",barindex,VxC-VxE,dialog,bold,19) coloured(102,102,102) else drawtext(" •",barindex,VxC-VxE,dialog,bold,19) coloured(102,102,102,30) endif if VxS = -6 then drawtext(" •",barindex,VxC-VxE,dialog,bold,19) coloured(102,102,102) else drawtext(" •",barindex,VxC-VxE,dialog,bold,19) coloured(102,102,102,30) endif if VxS = -7 then drawtext(" •",barindex,VxC-VxE,dialog,bold,19) coloured(102,102,102) else drawtext(" •",barindex,VxC-VxE,dialog,bold,19) coloured(102,102,102,30) endif if VxS = -8 then drawtext(" •",barindex,VxC-VxE,dialog,bold,19) coloured(102,102,102) else drawtext(" •",barindex,VxC-VxE,dialog,bold,19) coloured(102,102,102,30) endif if VxS = -9 then drawtext(" •",barindex,VxC-VxE,dialog,bold,19) coloured(102,102,102) else drawtext(" •",barindex,VxC-VxE,dialog,bold,19) coloured(102,102,102,30) endif if VxS = -10 then drawtext(" •",barindex,VxC-VxE,dialog,bold,19) coloured(102,102,102) else drawtext(" •",barindex,VxC-VxE,dialog,bold,19) coloured(102,102,102,30) endif return |
Share this
No information on this site is investment advice or a solicitation to buy or sell any financial instrument. Past performance is not indicative of future results. Trading may expose you to risk of loss greater than your deposits and is only suitable for experienced investors who have sufficient financial means to bear such risk.
ProRealTime ITF files and other attachments :PRC is also on YouTube, subscribe to our channel for exclusive content and tutorials
