

Price as Percentage of Error Band Range
This indicator calculates standard error bands on price and then presents price as a percentage of the error band range. This makes it much easier to visualise where price is in the range by removing the contracting and expanding of the error bands.
Below zero and price is below the lower error band and above 100 and price is above the upper error band.
Using this indicator hopefully market turning points can be more easily spotted. Upper and lower levels can be set to help with these decisions.
The normal error band settings can be adjusted if you want.
I advise downloading the itf file and importing it rather than cutting and pasting the code to ensure that you get full functionality.
Thank you to who ever wrote the original error band code that I used.
//Error Bands Perc of Range
// by Vonasi
//04 July 2018

P = 21
SDEG = 1
MF=2
UpperLevel = 90
LowerLevel = 10

AR = close
N = barindex
LR = Average[SDEG](linearregression[P](AR))

bv1 = summation[P](N*AR) - (P*Average[P](N)*Average[P](AR))
bv2 = summation[P](square(N)) - (P*square(Average[P](N)))
CalcB = bv1 / bv2

CalcA = Average[P](AR) - (CalcB*Average[P](N))

sev1 = Summation[P](square(AR)) - (CalcA*Summation[P](AR)) - (CalcB*Summation[P](N*AR))
sev3 = P - 2
SE = sqrt(sev1 / sev3)

UB = LR + (SE * MF)
BB = LR - (SE * MF)

topline = UB - LR
bottomline = LR - BB
gap = topline + bottomline
closeline = ((customclose - bb) / gap) * 100

return LowerLevel as "Lower Level", UpperLevel as "UpperLevel", closeline as "Price"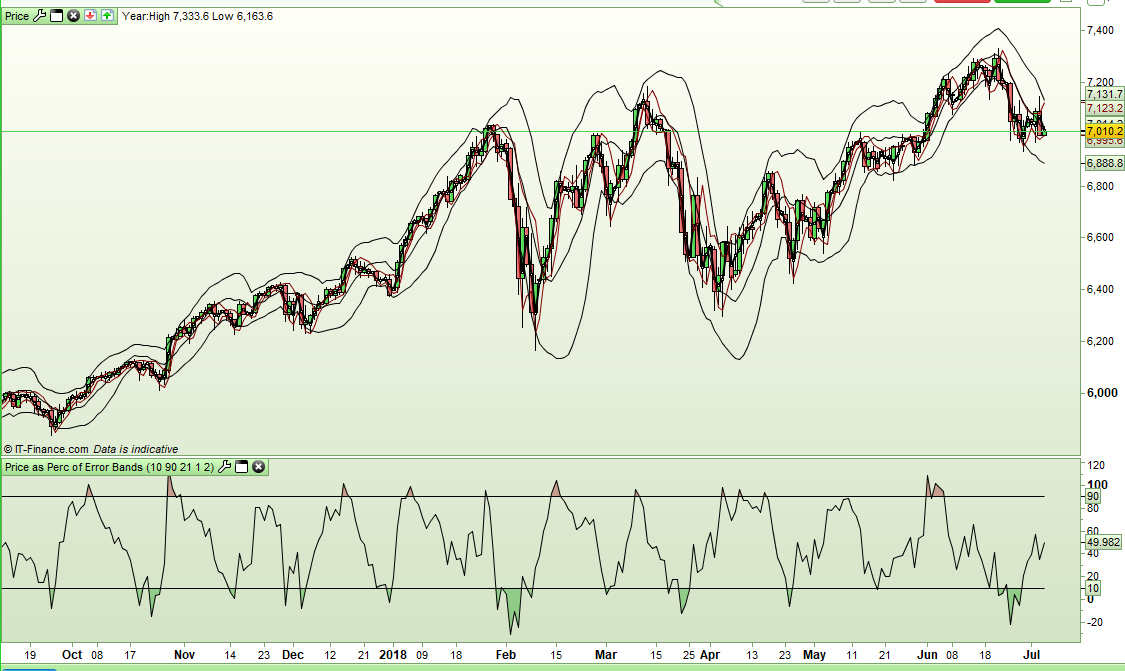