Goodnight.
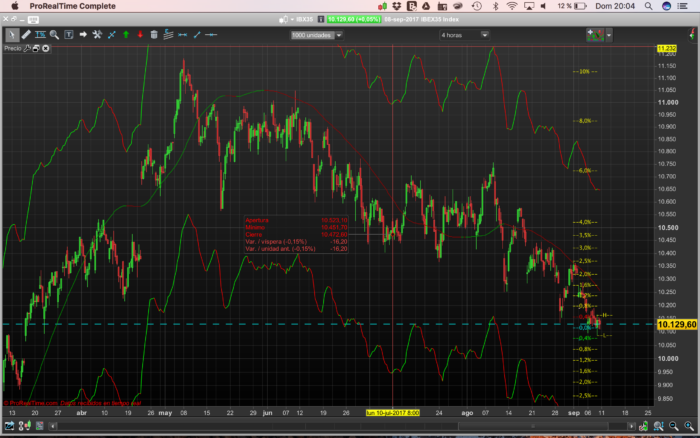
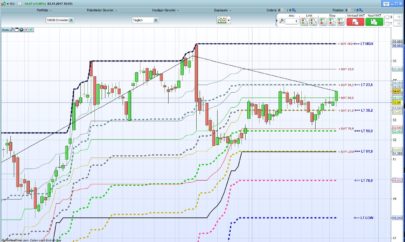
I wanted to share with you this simple visual indicator on the price that shows a scale% with which at a glance you can see the% price movement.
I hope you find it useful.
regards
Buenas Noches.
Queria compartir con vosotros este sencillo indicador visual sobre el precio que muestra una escala% con la que a simple vista se puede ver el movimiento % del precio .
Espero que os sea de utilidad.
Saludos
|
1 2 3 4 5 6 7 8 9 10 11 12 13 14 15 16 17 18 19 20 21 22 23 24 25 26 27 28 29 30 31 32 33 34 35 36 37 38 39 40 41 42 43 44 45 46 47 48 49 50 51 52 53 54 55 56 57 58 59 60 61 62 63 64 65 66 67 68 69 70 71 72 73 74 75 76 77 78 79 80 81 82 83 84 85 86 87 88 89 90 91 92 93 94 95 96 97 98 99 100 101 102 103 104 105 106 107 108 109 110 111 112 113 114 115 116 117 118 119 120 121 122 123 124 125 126 127 128 129 130 131 |
defparam DRAWONLASTBARONLY = True If ConstantePrecio = 1 Then Price = dclose(0) else Price = dopen(0) endif c5 = Price X = Desplazamiento c60 = c5 * 0.004 c6 = c5 + c60 c70 = c5 * 0.008 c7 = c5 + c70 c80 = c5 * 0.012 c8 = c5 + c80 c90 = c5 * 0.016 c9 = c5 + c90 c100= c5 * 0.02 c10 = c5 +c100 c110= c5 * 0.025 c11 = c5 +c110 c120= c5 * 0.03 c12 = c5 +c120 c130= c5 * 0.035 c13 = c5 +c130 c140= c5 * 0.04 c14 = c5 +c140 c150= c5 * 0.06 c15 = c5 +c150 c160= c5 * 0.08 c16 = c5 +c160 c170= c5 * 0.1 c17 = c5 +c170 c180= c5 * 0.13 c18 = c5 +c180 c190= c5 * 0.16 c19 = c5 +c190 c200= c5 * 0.2 c20 = c5 +c200 //======================= c210= c5 * 0.004 c21 = c5 -c210 c220= c5 * 0.008 c22 = c5 -c220 c230= c5 * 0.012 c23 = c5 -c230 c240= c5 * 0.016 c24 = c5 -c240 c250= c5 * 0.02 c25 = c5 -c250 c260= c5 * 0.025 c26 = c5 -c260 c270= c5 * 0.03 c27 = c5 -c270 c280= c5 * 0.035 c28 = c5 -c280 c290= c5 * 0.04 c29 = c5 -c290 c300= c5 * 0.06 c30 = c5 -c300 c310= c5 * 0.08 c31 = c5 -c310 c320= c5 * 0.1 c32 = c5 -c320 c330= c5 * 0.13 c33 = c5 -c330 c340= c5 * 0.16 c34 = c5 -c340 c350= c5 * 0.2 c35 = c5 -c350 DRAWTEXT(" --0,0%--", barindex[x], c5,Dialog,Standard,10) coloured (0,255,255) DRAWTEXT(" --0,4%--", barindex[x], c6) coloured (255,0,0) DRAWTEXT(" --0,8%--", barindex[x], c7) coloured (255,255,0) DRAWTEXT(" --1,2%--", barindex[x], c8) coloured (255,255,0) DRAWTEXT(" --1,6%--", barindex[x], c9) coloured (255,255,0) DRAWTEXT(" --2,0%--", barindex[x], c10) coloured (255,255,0) DRAWTEXT(" --2,5%--", barindex[x], c11) coloured (255,255,0) DRAWTEXT(" --3,0%--", barindex[x], c12) coloured (255,255,0) DRAWTEXT(" --3,5%--", barindex[x], c13) coloured (255,255,0) DRAWTEXT(" --4,0%--", barindex[x], c14) coloured (255,255,0) DRAWTEXT(" --6,0%--", barindex[x], c15) coloured (255,255,0) DRAWTEXT(" --8,0%--", barindex[x], c16) coloured (255,255,0) DRAWTEXT(" --10% --", barindex[x], c17) coloured (255,255,0) DRAWTEXT(" --13% --", barindex[x], c18) coloured (255,255,0) DRAWTEXT(" --16% --", barindex[x], c19) coloured (255,255,0) DRAWTEXT(" --20% --", barindex[x], c20) coloured (255,255,0) //============== DRAWTEXT(" --0,4%--", barindex[x], c21) coloured (0,255,0) DRAWTEXT(" --0,8%--", barindex[x], c22) coloured (255,255,0) DRAWTEXT(" --1,2%--", barindex[x], c23) coloured (255,255,0) DRAWTEXT(" --1,6%--", barindex[x], c24) coloured (255,255,0) DRAWTEXT(" --2,0%--", barindex[x], c25) coloured (255,255,0) DRAWTEXT(" --2,5%--", barindex[x], c26) coloured (255,255,0) DRAWTEXT(" --3,0%--", barindex[x], c27) coloured (255,255,0) DRAWTEXT(" --3,5%--", barindex[x], c28) coloured (255,255,0) DRAWTEXT(" --4,0%--", barindex[x], c29) coloured (255,255,0) DRAWTEXT(" --6,0%--", barindex[x], c30) coloured (255,255,0) DRAWTEXT(" --8,0%--", barindex[x], c31) coloured (255,255,0) DRAWTEXT(" --10% --", barindex[x], c32) coloured (255,255,0) DRAWTEXT(" --13% --", barindex[x], c33) coloured (255,255,0) DRAWTEXT(" --16% --", barindex[x], c34) coloured (255,255,0) DRAWTEXT(" --20% --", barindex[x], c35) coloured (255,255,0) DRAWTEXT(" --H--", barindex[x-5], dhigh(0)) coloured (255,255,0) DRAWTEXT(" --L--", barindex[x-5], dlow(0)) coloured (255,255,0) c1= high * 0.004 c2 = high + c1 c3= low * 0.004 c4 = low - c3 DRAWSEGMENT(barindex[x-1], c2, barindex[x-2], c2) coloured (255,204,204) DRAWSEGMENT(barindex[x-1], c4, barindex[x-2], c4) coloured (0,255,255) return //(0, 0, 0)negro //(255, 255, 255)blanco //(255, 0, 0)rojo //(0, 255, 0)verde //(0, 0, 255)azul //(255, 255, 0)amarillo //(0, 255, 255)azul celeste |
Share this
No information on this site is investment advice or a solicitation to buy or sell any financial instrument. Past performance is not indicative of future results. Trading may expose you to risk of loss greater than your deposits and is only suitable for experienced investors who have sufficient financial means to bear such risk.
ProRealTime ITF files and other attachments :PRC is also on YouTube, subscribe to our channel for exclusive content and tutorials


Ciao. avrei necessità di usare questo indicatore in intraday . Dovrei poter dare un prezzo di partenza tutti i giorni e poi l’indicatore traccia le percentuali positive e negative dal punto che ho determinato. si può fare ? grazie