Projection Bands were developed by Mel Widner, Ph.D. They were originally introduced in the July 1995 issue of Technical Analysisof Stocks and Commodities magazine.
The Projection Oscillator is based on the Projection Bands indicator. The Oscillator calculates where the close lies within the band as a percentage.
The Projection Oscillator can be interpreted several ways.
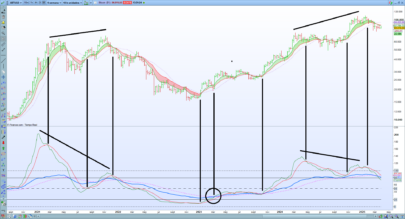
Look for divergence with price to indicate a trend reversal. Extreme values (over 80 or under 20) indicate overbought/oversold levels.
A moving average of the oscillator can be used as a trigger line. A buy/sell signal is generated when the Projection Oscillator to cross above/below the trigger line. The signal is stronger if it happens above 70 or below 30.
Parameters
Periods (n = 14)
|
1 2 3 4 5 6 7 8 9 10 11 12 13 14 15 |
SlopeHigh = LINEARREGRESSIONSLOPE[n](high) SlopeLow = LINEARREGRESSIONSLOPE[n](low) UpProjBand = high LoProjBand = low FOR i = 1 TO n UpProjBand = MAX(UpProjBand, high[i] + i * SlopeHigh) LoProjBand = MIN(LoProjBand, low[i] - i * SlopeLow) NEXT ProOsc = 100 * (Close - LoProjBand) / (UpProjBand - LoProjBand) RETURN ProOsc AS"ProOsc",20 AS"Line 20",80 AS"Line 80" |
Share this
No information on this site is investment advice or a solicitation to buy or sell any financial instrument. Past performance is not indicative of future results. Trading may expose you to risk of loss greater than your deposits and is only suitable for experienced investors who have sufficient financial means to bear such risk.
ProRealTime ITF files and other attachments :PRC is also on YouTube, subscribe to our channel for exclusive content and tutorials


