Projection Oscillator

Projection Oscillator

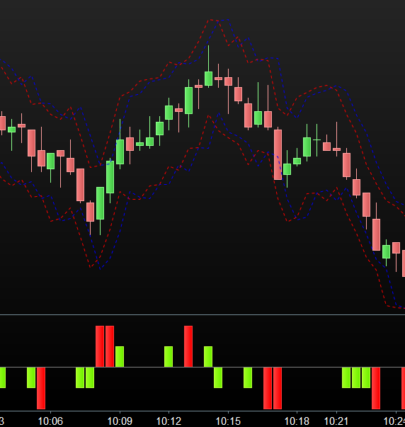
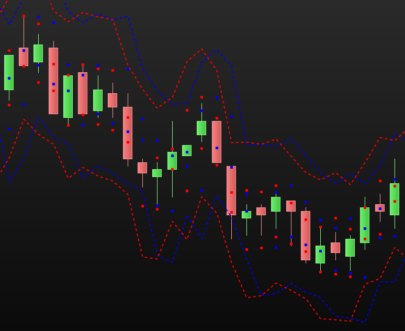
Projection Bands were developed by Mel Widner, Ph.D. They were originally introduced in the July 1995 issue of Technical Analysisof Stocks and Commodities magazine.

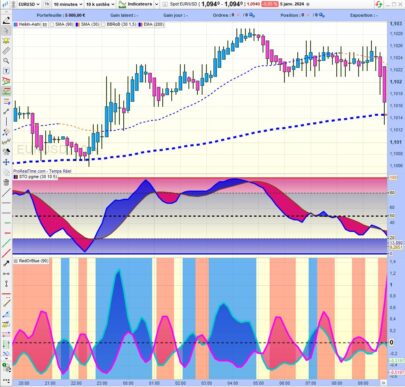
The Projection Oscillator is based on the Projection Bands indicator. The Oscillator calculates where the close lies within the band as a percentage.

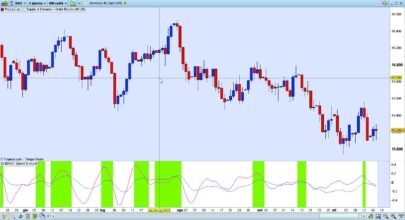
The Projection Oscillator can be interpreted several ways.

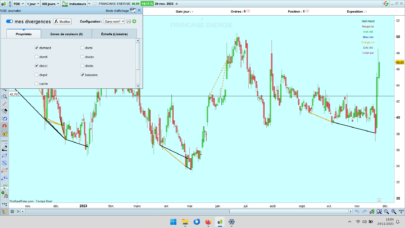
Look for divergence with price to indicate a trend reversal. Extreme values (over 80 or under 20) indicate overbought/oversold levels.

A moving average of the oscillator can be used as a trigger line. A buy/sell signal is generated when the Projection Oscillator to cross above/below the trigger line. The signal is stronger if it happens above 70 or below 30.

Parameters

Periods (n = 14)

Share this

Risk disclosure:

No information on this site is investment advice or a solicitation to buy or sell any financial instrument. Past performance is not indicative of future results. Trading may expose you to risk of loss greater than your deposits and is only suitable for experienced investors who have sufficient financial means to bear such risk.

ProRealTime ITF files and other attachments : How to import ITF files into ProRealTime platform?

PRC is also on YouTube, subscribe to our channel for exclusive content and tutorials

avatar
Register or

Likes

avatar avatar
Related users ' posts
Fgats quelques explications en Français ici : Some explanations in French here : https://www.p...
Nicolas Merci pour cette contribution, j'apprécie ! :)
Fgats Merci Nicolas pour ces encouragements et merci aussi pour le commentaire en Anglais accompa...
Msport71 Thank You very much
luxrun A question: what are the initial (or default) values ​​of maximum and minimum in the executi...
jacquesgermain Bonjour non pas de soucis car src=customclose donc dans le menu configuration/propriété me...
geroniman Merci Jacques , indic tres utile. J'ai un indic à programmer avec du price action. es tu dis...
jacquesgermain ok pour regarder ...
Bateson
1 year ago
Bateson
1 year ago
Quino
1 year ago
Bateson
1 year ago
MACD Reloaded
MACD Reloaded
2
Indicators
NEOMKEY Nada nuevo
Carlose I love your version of the MACD, if you use it you can get a lot of use out of it, for me ma...
Bateson
1 year ago
TSI 3.0
TSI 3.0
6
Indicators
Fgats a = (Average[l1,m1](Average[l2,m2](ROC[mfvalue](close)))) b = (Average[l3,m3](Average[l4,m4...
Bateson Fgats, Un grand merci. Cela fonctionne parfaitement. J'ai bien compris la partie à rajouter ...
bousalahane hello, thank you for sharing, I’m not top strong in the programation part, there is a way to...
Fgats Hi, With this indicator I just wanted to show the interest that can exist to synthesize th...
davidguerreir how to adapt nbStdSig values ?
lkiklkik thanks a lot. description of the indicator seems wrong ...
robertogozzi Sorry, you're right. The correct description, from https://www.tradingview.com/script/omlpq...
Razz Hello Nicolas I really like this indicator, but unfortunately it keeps drawing huge gaps fro...
Jo-01-R Bonjour Nicolas, je voulais savoir si vous aviez des competences en programation NT8 ? Car j...
lukapex hello Nicolas! i want to get in touch with you. I have my own strategy and my own indicators...
Actaru5 Hi, I couldn't see the candles well. Changing the code solves the problem. from line 164 to...
LucasBest Thank you
Alai-n @LucasBest Hello, do you think it is possible to isolate moving averages? I would like to us...
Alai-n I really like it when you develop ideas around price movement! I am much less a fan of all t...
finplus Bonjour, une petite demande concernant cet indicateur : comment faire pour que lorsque la bo...
LucasBest Bonjour, la coloration des bandes se fait ligne 111 et 112 à l'aide des instructions colorbe...

Top