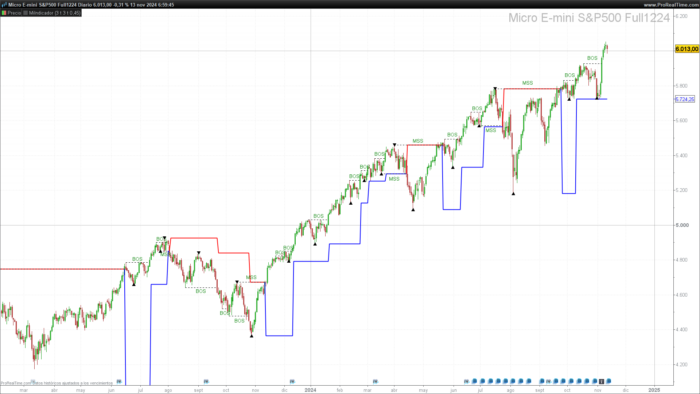
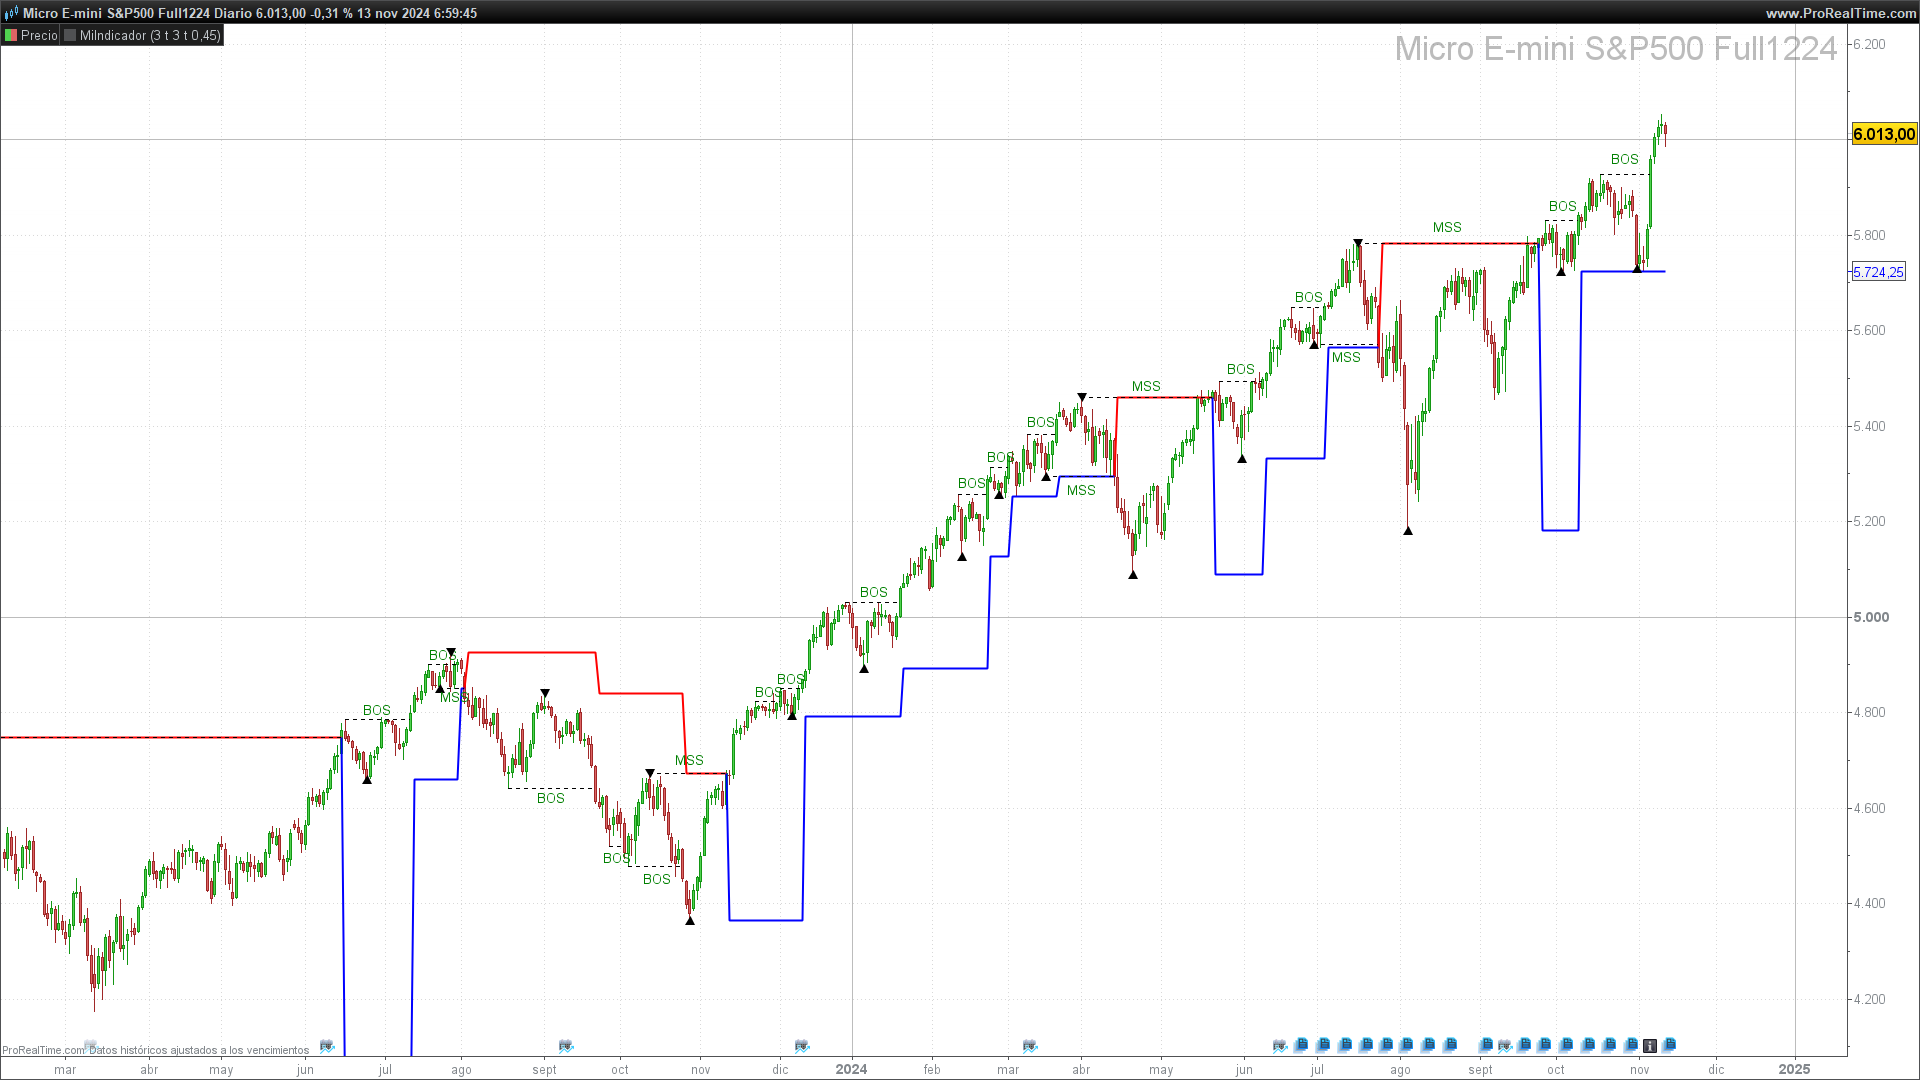
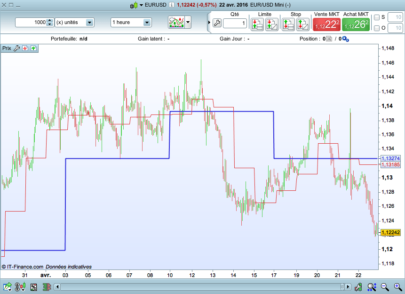
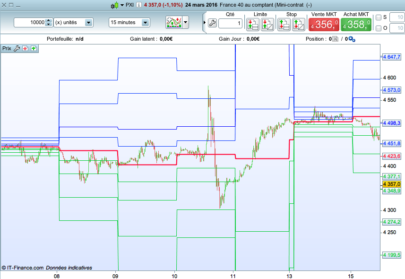
The Protected Highs & Lows indicator is an advanced tool that helps traders identify critical support and resistance points on a chart. These levels are based on the identification of high and low pivots that meet specific confirmation criteria. Through these pivots, the indicator signals potential changes in price direction and helps validate breakouts or structural changes in the market, known as “BOS” (Break of Structure) and “MSS” (Market Structure Shift).
This indicator is especially useful in trading stocks, forex, and futures, where accurately identifying support and resistance can improve decision-making by providing clarity in volatile markets.
How the Indicator Works
The functionality of the indicator is based on detecting protected high and low pivots. These pivot points are determined by using a combination of the high and low price levels and the Average True Range (ATR) to establish the confirmation distance.
- Pivot Detection: The indicator examines recent prices to find conditions that qualify a point as a high or low pivot. To do this, it evaluates whether the current price exceeds certain levels and meets high or low conditions within a defined period.
- Protected Level Confirmation: Once a pivot has been identified, the indicator assesses whether the price has held or surpassed that level, turning it into a protected level. These points are highlighted on the chart and serve as critical support or resistance zones.
- BOS and MSS Labels: At confirmed pivot points, the indicator can display “BOS” or “MSS” labels based on the structural change. These terms help interpret whether the price is breaking an existing structure or shifting market structure.
Configuration Parameters
The indicator offers a range of customizable settings to adjust its behavior based on user preferences or specific analysis needs. Here are some key parameters:
- ps (Analysis Period): Defines the number of bars the indicator uses to determine whether the price meets the pivot conditions. Higher values make the indicator more conservative in detecting pivots.
- ATR (Average True Range): The ATR is a key component in calculating the confirmation distances for pivots. By default, the ATR period is set to 14 bars, though it can be adjusted to fit different time frames or volatilities.
- Coefficient (coef): This parameter adjusts the sensitivity of the confirmation level relative to the ATR. A higher coefficient increases the protective distance for pivots, while a lower value decreases this distance, showing more pivot points.
- Labels (showLabels and labelType): Users can decide whether to display labels at pivots and, if so, choose the label type: only market structure shifts (MSS), breakouts of structure (BOS), or both.
- Show Protected Highs & Lows (showphl): Activates or deactivates the display of ▲ and ▼ symbols indicating the presence of protected highs and lows on the chart.
Implementation and ProBuilder Code
Below is the ProBuilder code for the Protected Highs & Lows indicator.
|
1 2 3 4 5 6 7 8 9 10 11 12 13 14 15 16 17 18 19 20 21 22 23 24 25 26 27 28 29 30 31 32 33 34 35 36 37 38 39 40 41 42 43 44 45 46 47 48 49 50 51 52 53 54 55 56 57 58 59 60 61 62 63 64 65 66 67 68 69 70 71 72 73 74 75 76 77 78 79 80 81 82 83 84 85 86 87 88 89 90 91 92 93 94 95 96 97 98 99 100 101 102 103 104 105 106 107 108 109 110 111 112 113 114 115 116 117 118 119 120 121 122 123 124 125 126 127 128 129 130 131 132 133 134 135 136 137 138 139 140 141 142 143 144 145 146 147 148 149 150 151 152 153 154 155 156 157 158 159 160 161 162 163 164 165 166 167 168 169 170 171 172 173 174 175 176 177 178 179 180 181 182 183 184 185 186 187 188 189 190 191 192 193 194 195 196 197 198 199 200 201 202 203 204 205 206 207 208 209 210 211 212 213 214 215 216 |
//-----------------------------------------------------------// //PRC_Protected Highs & Lows //version = 0 //18.06.24 //Iván González @ www.prorealcode.com //Sharing ProRealTime knowledge //-----------------------------------------------------------// //-----Inputs------------------------------------------------// ps = 1 src1 = low src2 = high showLabels=1 labelType=3 //1=MSS 2=BOS 3=All showphl=1 atr=averagetruerange[14](close) coef=0.45 //-----------------------------------------------------------// once lastlow=0 once lastlowidx=0 once lasthigh=0 once lasthighidx=0 once trackhigh=0 once trackhighidx=0 once tracklow=0 once tracklowidx=0 //-----------------------------------------------------------// //-----Pivots low--------------------------------------------// if src1 > src1[ps] and lowest[ps](src1) > src1[ps] and src1[ps] < lowest[ps](src1)[ps+1] and not isset($pl[0]) then $pivotl[t+1]=src1[ps] t=t+1 $pl[0]=src1[ps] $plx[0] = barindex[ps] pPricelow=high[ps] pIdx=barindex[ps] pBull=0 pValidlow=0 if lastlow=0 then lastlow = low[ps] lastlowidx = barindex[ps] else if low[ps] < lastlow then lastlow = low[ps] lastlowidx = barindex[ps] endif endif //drawpoint(barindex[ps],src1[ps],2)coloured("blue",150) endif //-----------------------------------------------------------// //-----Pivots high-------------------------------------------// if src2 < src2[ps] and highest[ps](src2)<src2[ps] and src2[ps]>highest[ps](src2)[ps+1] and not isset($ph[0]) then $pivoth[z+1]=src2[ps] z=z+1 $ph[0]=src2[ps] $phx[0] = barindex[ps] pPricehigh=low[ps] pIdx=barindex pBull=1 pValidhigh=0 if lasthigh=0 then lasthigh = high[ps] lasthighidx = barindex[ps] else if high[ps] > lasthigh then lasthigh = high[ps] lasthighidx = barindex[ps] endif endif //drawpoint(barindex[ps],src2[ps],2)coloured("red",150) endif //-----------------------------------------------------------// if pBull then if close<pPricehigh and pValidhigh=0 then pValidhigh=1 endif else if close>pPricehigh and pValidhigh=0 then pValidhigh=1 endif endif if pBull then if close<pPricelow and pValidlow=0 then pValidlow=1 endif else if close>pPricelow and pValidlow=0 then pValidlow=1 endif endif //-----------------------------------------------------------// if (high[ps]>trackHigh or trackhigh=0 or lastlowidx>=trackHighidx) and isset($ph[0]) and pValidlow then trackhigh=high[ps] trackhighidx=barindex[ps] endif if (low[ps]<tracklow or tracklow=0 or lasthighidx>=tracklowidx) and isset($pl[0]) and pValidhigh then tracklow=low[ps] tracklowidx=barindex[ps] endif //-----------------------------------------------------------// bosbear=0 bosbull=0 mssbear=0 mssbull=0 change=0 if isset($ph[0]) then if close > $ph[0] then if showLabels then if labelType=1 and not bull then drawtext("MSS",(barindex+$phx[0])/2,$ph[0]+coef*atr)coloured("green") drawsegment(barindex,$ph[0],$phx[0],$ph[0])style(dottedline) elsif labelType=2 and bull then drawtext("BOS",(barindex+$phx[0])/2,$ph[0]+coef*atr)coloured("green") drawsegment(barindex,$ph[0],$phx[0],$ph[0])style(dottedline) elsif labelType=3 and not bull then drawtext("MSS",(barindex+$phx[0])/2,$ph[0]+coef*atr)coloured("green") drawsegment(barindex,$ph[0],$phx[0],$ph[0])style(dottedline) elsif labelType=3 and bull then drawtext("BOS",(barindex+$phx[0])/2,$ph[0]+coef*atr)coloured("green") drawsegment(barindex,$ph[0],$phx[0],$ph[0])style(dottedline) endif endif if bull then bosbull=1 else mssbull=1 endif bull=1 change=1 unset($ph) unset($phx) unset($pl) unset($plx) if tracklow>0 then if showphl then drawtext("▲",barindex[barindex-tracklowidx],tracklow) endif $pl[0]=tracklow $plx[0]=barindex[barindex-tracklowidx] lasthigh=0 endif endif endif if isset($pl[0]) then if close < $pl[0] then if showLabels then if labelType=1 and bull then drawtext("MSS",(barindex+$plx[0])/2,$pl[0]-coef*atr)coloured("green") drawsegment(barindex,$pl[0],$plx[0],$pl[0])style(dottedline) elsif labelType=2 and not bull then drawtext("BOS",(barindex+$plx[0])/2,$pl[0]-coef*atr)coloured("green") drawsegment(barindex,$pl[0],$plx[0],$pl[0])style(dottedline) elsif labelType=3 and not bull then drawtext("BOS",(barindex+$plx[0])/2,$pl[0]-coef*atr)coloured("green") drawsegment(barindex,$pl[0],$plx[0],$pl[0])style(dottedline) elsif labelType=3 and bull then drawtext("MSS",(barindex+$plx[0])/2,$pl[0]-coef*atr)coloured("green") drawsegment(barindex,$pl[0],$plx[0],$pl[0])style(dottedline) endif endif if not bull then bosbear=1 else mssbear=1 endif bull=0 change=1 unset($ph) unset($phx) unset($pl) unset($plx) if trackhigh>0 then if showphl then drawtext("▼",barindex[barindex-trackhighidx],trackhigh) endif $ph[0]=trackhigh $phx[0]=barindex[barindex-trackhighidx] lastlow=0 endif endif endif //-----------------------------------------------------------// if change[1] then if bosbear[1] or mssbear[1] then trailprice=trackhigh r=255 b=0 elsif bosbull[1] or mssbull[1] then trailprice=tracklow r=0 b=255 endif endif //-----------------------------------------------------------// return trailprice coloured(r,0,b)style(line,2) |
Share this
No information on this site is investment advice or a solicitation to buy or sell any financial instrument. Past performance is not indicative of future results. Trading may expose you to risk of loss greater than your deposits and is only suitable for experienced investors who have sufficient financial means to bear such risk.
ProRealTime ITF files and other attachments :
Find other exclusive trading pro-tools on ![]()
PRC is also on YouTube, subscribe to our channel for exclusive content and tutorials


buenas tardes pero es un sistema que repinta
por que pasa eso si repinta no sirve.gracias de todas formas decirte que eres un crack
Bonjour Ivan je ne sais pas si je dois écrire en Français ,anglais ,espagnol ,il y a les 3 langues utilisées et il n’y a pas de drapeau , Roberto qui passe son temps à nous dire qu’on utilise pas le bon langage
va encore réagir, ce serait mieux Roberto que tu nous donnes de temps en temps une stratégie qui fonctionne..
Ivan ton travail sur les indicateurs est remarquable mais il faut aller plus loin et nous donner si possible à chaque nouvel indicateur une stratégie qui pourrait s’adapter à cet indicateur.
Ou une façon de l’utiliser en stratégie automatique. Je t’en crois capable.
Bonne journée
Bonjour, la vérité est que ce n’est pas aussi facile qu’il n’y paraît…. Un indicateur peut être utilisé dans une stratégie uniquement pour ouvrir des positions, uniquement pour fermer des positions, les deux options, pour filtrer des valeurs, pour combiner avec d’autres indicateurs… Bref, cela ouvre un monde beaucoup plus vaste.
J’ai également commencé à créer des screeners et j’espère pouvoir montrer un jour un système automatisé avec ces indicateurs que je partage.
Merci Ivan j’espère que ce jour viendra bientôt , je sais que ce n’est pas facile car les indicateurs ne prédisent pas l’avenir j’ai moi même essayé plusieurs stratégies avec moyennement de succès
ce qui me parait le plus difficile s’est de ne pas sortir d’un canal pour éviter les coups de boutoirs des grandes bougies ou des grandes mèches.
Tes connaissances et tes facilités à traduire les indicateurs sont remarquables j”ai confiance en toi pour aller plus loin.