
1. Introduction
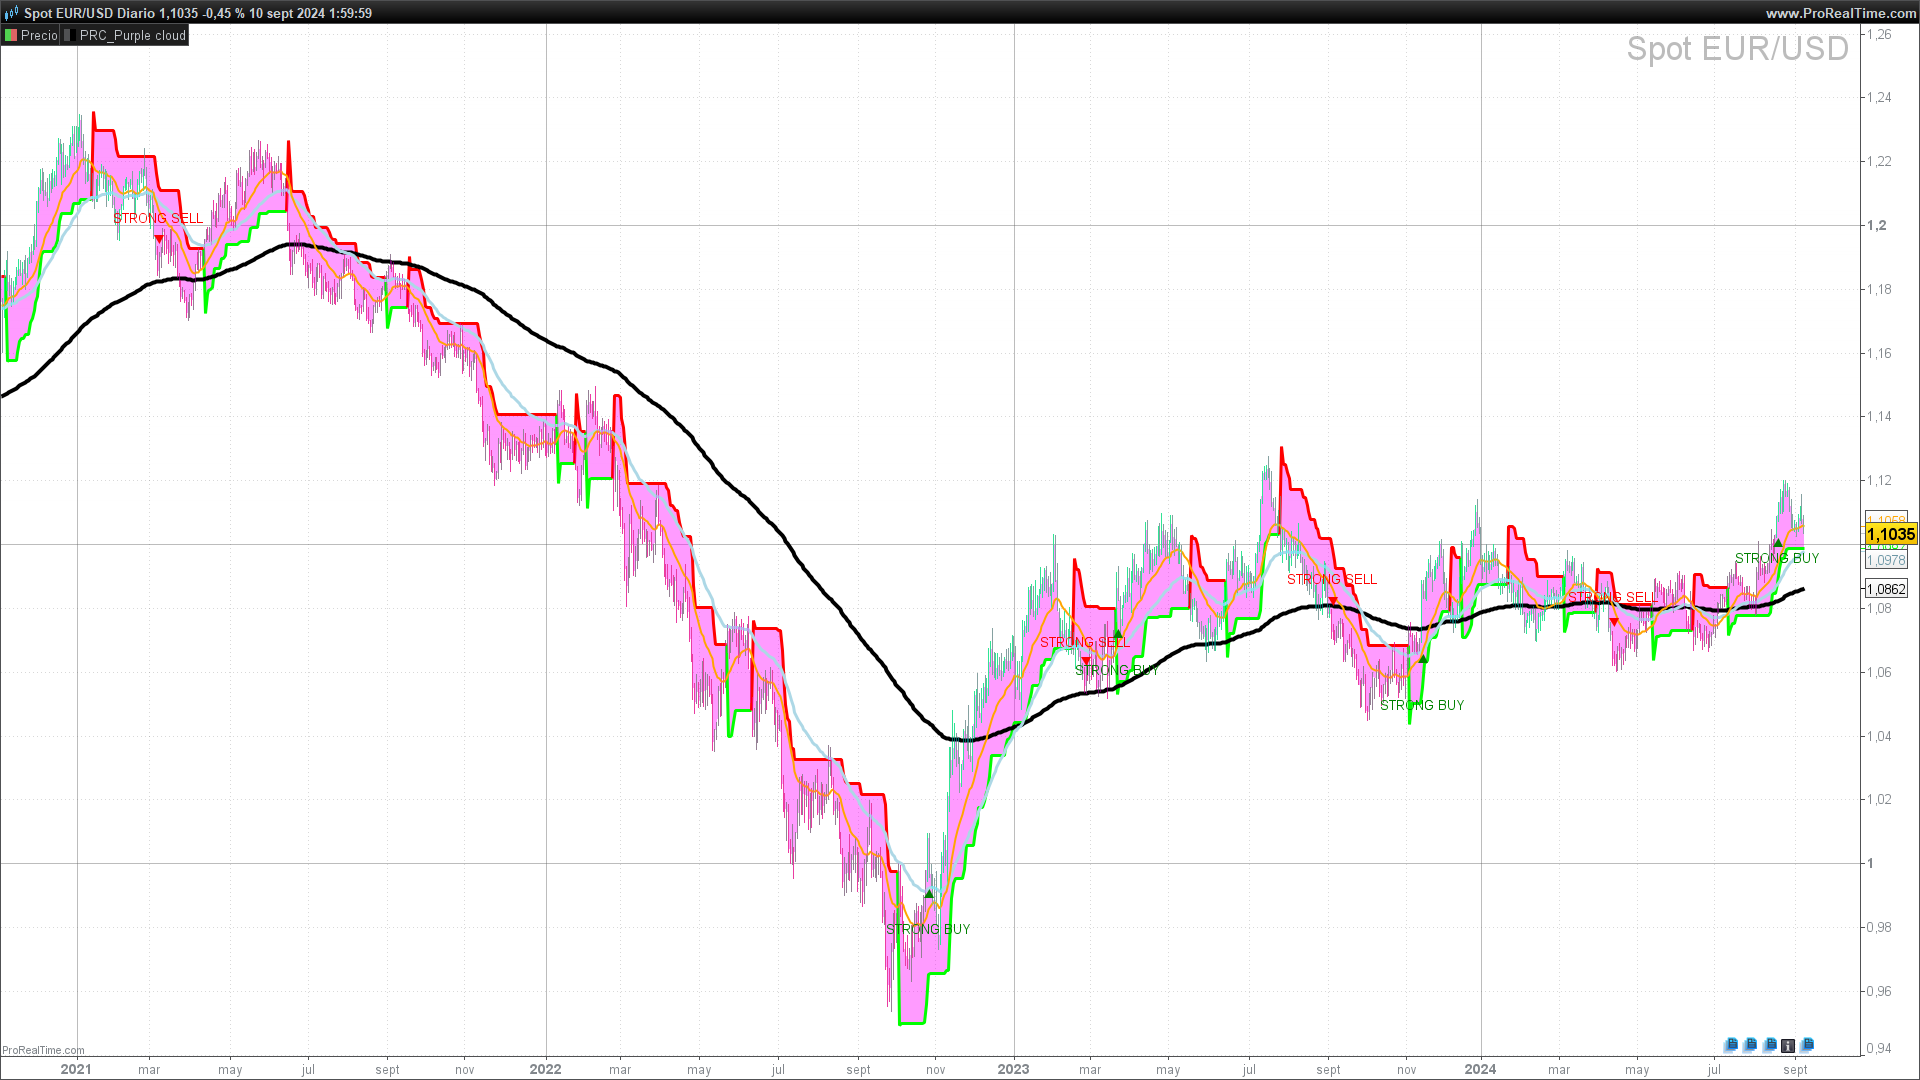
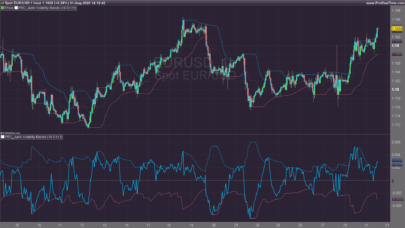
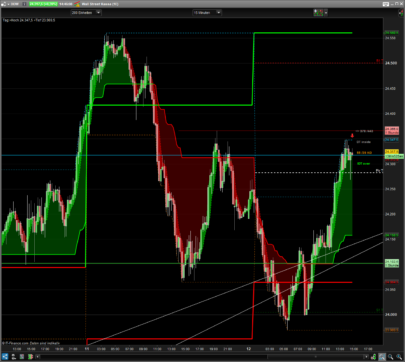
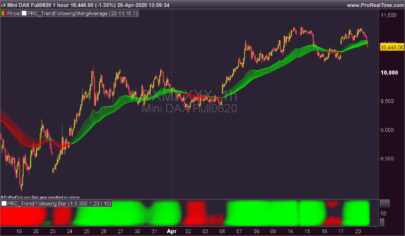
The Purple Cloud indicator is an advanced technical tool designed to help traders identify entry and exit points in the market, based on a combination of volatility bands, moving averages, and the popular SuperTrend. This indicator provides a clear visual representation of market conditions, making decision-making easier by showing buy and sell zones with colored candles and precise signals.
The Purple Cloud is mainly used in volatile markets or those with strong trends, where the use of volatility and price bands adjusted by volume pressure can provide high-probability signals. Additionally, it incorporates the ability to anticipate trend changes, making it ideal for both intraday and swing traders.
This indicator stands out for its ability to combine several key technical elements into a single visualization, allowing traders to cut through the market “noise” and focus on the most relevant signals. Furthermore, its versatility allows it to be applied across a wide range of assets, from stocks to currencies or cryptocurrencies.
2. Indicator Components
The Purple Cloud indicator consists of several technical elements that, together, provide a comprehensive view of the market. Below, we detail each of these components:
2.1 SuperTrend
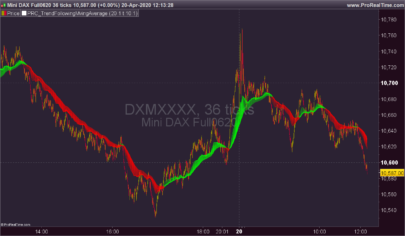
The SuperTrend is a popular indicator that follows the trend using price and market volatility. In Purple Cloud, the SuperTrend is used to confirm buy and sell signals, and its visualization depends on the price’s behavior in relation to its level.
- SuperTrend Parameters:
- atrperiod: Defines the length of the ATR (Average True Range), a volatility indicator used to calculate the SuperTrend bands. In Purple Cloud, the default value is 10.
- factor: Represents the multiplier applied to the ATR to define the distance of the SuperTrend bands from the price. In this case, the default value is 3. A higher factor smooths the signals, while a lower factor makes them more sensitive to market movements.
2.2 Upper and Lower Bands
The Purple Cloud uses bands based on the ATR, adjusted by a volatility factor. These bands help identify overbought and oversold zones, functioning similarly to Bollinger Bands, but with direct integration of buying and selling pressure in the calculation.
- Band Calculation:
- The upper band (xh) is calculated as the closing price plus a fraction of the ATR multiplied by the volatility factor (alpha), with a default value of 0.7.
- The lower band (xl) is calculated similarly but subtracting the fraction of the ATR instead of adding it.
These bands are combined with volume pressure through a weighted average, allowing the indicator to adjust to current market conditions and detect reversal points more accurately.
2.3 Buy and Sell Signals
Buy and sell signals are generated when the price crosses the defined bands and meets certain buying and selling pressure thresholds. This helps filter out price movements that lack sufficient volume pressure to be considered trading opportunities.
- Buying/Selling Pressure:
- bpt (Buying Pressure Threshold) defines the threshold for a valid buy signal. In the code, its default value is 1.4.
- spt (Selling Pressure Threshold) defines the threshold for sell signals, also with a default value of 1.4.
When these conditions are met, the indicator marks signals such as “STRONG BUY,” “BUY,” “SELL,” or “STRONG SELL” depending on the strength of the price crossing the bands.
2.4 Moving Averages (EMAs)
The indicator also incorporates three exponential moving averages (EMAs) of different periods (20, 50, and 200), allowing traders to identify short-, medium-, and long-term trends.
- EMA 20: Short-term moving average that helps detect quick trend changes.
- EMA 50: Medium-term moving average used to identify the strength of the current trend.
- EMA 200: Long-term moving average that serves as a key reference for defining the primary trend.
2.5 Candle Coloring
Purple Cloud offers the option to color candles based on the trend direction detected by the indicator:
- Cyan: Indicates a confirmed bullish trend.
- Fuchsia: Indicates a confirmed bearish trend.
This visual color coding helps traders quickly identify market direction without the need to analyze each technical element separately.
3. Indicator Configuration
The Purple Cloud offers several configurable parameters, allowing users to customize the indicator’s behavior according to their needs and trading style. Below, we explain each parameter and how they affect the indicator’s performance.
3.1 ATR Period (atrperiod)
This parameter defines the length of the Average True Range (ATR), which is the volatility indicator used to calculate the SuperTrend bands. A higher ATR value smooths the bands, making the indicator less sensitive to changes in volatility. By default, this value is set to 10.
- Recommendation: For volatile markets or assets with fast movements, it is recommended to use a lower value (e.g., 7). For more stable assets, a higher value (e.g., 14) can help reduce false signals.
3.2 SuperTrend Factor (factor)
This parameter determines the multiplier applied to the ATR to calculate the distance between the price and the SuperTrend bands. A higher value smooths the trend, while a lower value will make the SuperTrend more reactive. The default value is 3.
- Recommendation: A lower value may generate more signals, but it can also increase the risk of false signals in volatile markets. A higher value is more conservative and can be useful for identifying more defined trends.
3.3 Buying and Selling Pressure Threshold (bpt and spt)
These parameters define the percentage thresholds for buying pressure (bpt) and selling pressure (spt). They are used to filter out weak signals and only display buy or sell opportunities that exceed these thresholds.
- bpt (Buying Pressure Threshold): Default value of 1.4%. This means the price must be at least 1.4% above the lower band to generate a buy signal.
- spt (Selling Pressure Threshold): Default value of 1.4%. This means the price must be at least 1.4% below the upper band to trigger a sell signal.
3.4 Optional Visualization
Purple Cloud offers several visualization options to suit user preferences:
- drawsupertrend: Enables or disables SuperTrend visualization. If activated (default value 1), the SuperTrend will be displayed as a line on the chart.
- drawemas: Allows the user to show or hide exponential moving averages (EMAs) of 20, 50, and 200 periods. The default value is 1 (enabled).
- colorcandles: If activated (value 1), the candles will be colored depending on market direction: cyan for bullish trends and fuchsia for bearish trends.
- drawsignals: Enables or disables the display of buy and sell signals on the chart. If activated (value 1), labels such as “BUY,” “SELL,” “STRONG BUY,” or “STRONG SELL” will be shown when the conditions are met.
4. Practical Application
The Purple Cloud indicator is designed to provide clear and precise signals under different market conditions. Below, we describe how to use this indicator in real-world situations and how to correctly interpret its signals.
4.1 Interpreting Buy and Sell Signals
The Purple Cloud generates buy and sell signals based on two key criteria: price crossing the volatility bands and a change in the direction of the trend as marked by the indicator (xs <> xs[1]). A buy or sell signal is only generated when both criteria are met.
- Buy Signal (BUY): A buy signal is triggered when the buysignal condition is met (the price falls below the lower band, xl) and the trend changes (xs <> xs[1]). This indicates a potential bullish reversal. Additionally, if the price is above the SuperTrend at the time of the signal, it is considered a “STRONG BUY”, reinforcing the likelihood of a significant upward move.
- Sell Signal (SELL): A sell signal is triggered when the price crosses the upper band (xh) and the trend changes (xs <> xs[1]), suggesting a potential bearish reversal. If the price is below the SuperTrend, the signal is classified as “STRONG SELL”, indicating a higher probability of a downward movement.
4.2 Using SuperTrend for Confirmation
The SuperTrend is used as an additional confirmation tool. Standard buy and sell signals (BUY/SELL) are generated when the price crosses the volatility bands, but the SuperTrend helps determine whether the trend is strong enough to classify the signal as “strong” or just a standard signal.
- Bullish Confirmation (STRONG BUY): If the price is above the SuperTrend when a buy signal is generated, this is classified as a “STRONG BUY”. This indicates that the bullish trend is stronger and more likely to continue.
- Bearish Confirmation (STRONG SELL): Similarly, if the price is below the SuperTrend when a sell signal is generated, it is classified as a “STRONG SELL”, suggesting that the bearish trend is strong and expected to continue.
4.3 Suggested Trading Strategies
Reversal Strategy with Trend Confirmation
This strategy takes advantage of reversal points when the price crosses the Purple Cloud bands, and the trend changes. Buy and sell signals are used to open positions, with the SuperTrend confirming the signal’s strength.
Strategy Rules:
- Long Entry (buy): Open a long position when the Purple Cloud issues a “BUY” signal (or preferably, a “STRONG BUY” if the price is above the SuperTrend).
- Short Entry (sell): Open a short position when a “SELL” signal is generated (or “STRONG SELL” if the price is below the SuperTrend).
- Exit Position: Close the position when a contrary signal is generated, or when the price crosses back over the SuperTrend.
Moving Averages Strategy
In less volatile markets, Purple Cloud‘s moving averages (EMAs) can be used to identify long-term trends, supporting buy and sell signals.
Strategy Rules:
- Bullish Trend: If the 20-period EMA crosses above the 50-period EMA, this reinforces buy signals from the indicator.
- Bearish Trend: If the 20-period EMA crosses below the 50-period EMA, it reinforces sell signals, suggesting that the downtrend is holding.
4.4 Indicator Optimization
The Purple Cloud is highly customizable, allowing users to adjust the parameters according to market conditions or their trading style. For example, a lower atrperiod or factor value will make the indicator more reactive, which can be useful in fast-moving markets, but it may also generate more false signals.
It is recommended to perform tests and backtesting with different assets and adjust the parameters based on the volatility and specific characteristics of the market being traded.
5. Indicator Code in ProBuilder
Below is the complete code for the Purple Cloud indicator in ProBuilder language, which you can use directly on your ProRealTime platform. This code includes the logic for calculating the SuperTrend, volatility bands, moving averages, and buy/sell signals, along with visualization options like candle coloring and signal representation on the chart.
|
1 2 3 4 5 6 7 8 9 10 11 12 13 14 15 16 17 18 19 20 21 22 23 24 25 26 27 28 29 30 31 32 33 34 35 36 37 38 39 40 41 42 43 44 45 46 47 48 49 50 51 52 53 54 55 56 57 58 59 60 61 62 63 64 65 66 67 68 69 70 71 72 73 74 75 76 77 78 79 80 81 82 83 84 85 86 87 88 89 90 91 92 93 94 95 96 97 98 99 100 101 102 103 104 105 106 |
//-----------------------------------------------------// //PRC_Purple cloud //version = 1 //09.09.2024 //Iván González @ www.prorealcode.com //Sharing ProRealTime knowledge //-----------------------------------------------------// //-----Inputs------------------------------------------// //-----------------------------------------------------// atrperiod=10 //SuperTrend ATR length factor=3 //Supertrend factor x1=14 alpha=0.7 bpt=1.4//Buying Pressure Threshold % spt=1.4//Selling Pressure Threshold % drawsupertrend=1 //Draw Supertrend drawemas=1 //Draw EMAs colorcandles=1 //Color candles drawsignals=1 //Draw Signals //-----------------------------------------------------// //-----SuperTrend--------------------------------------// //-----------------------------------------------------// St=Supertrend[factor,atrperiod] //-----------------------------------------------------// //-----Up and Down Bands-------------------------------// //-----------------------------------------------------// x2=averagetruerange[x1](close)*alpha xh=close+x2 xl=close-x2 a1=VolumeAdjustedAverage[floor(x1/4)]((high+low)/2*volume)/VolumeAdjustedAverage[floor(x1/4)](volume) a2=VolumeAdjustedAverage[floor(x1/2)]((high+low)/2*volume)/VolumeAdjustedAverage[floor(x1/2)](volume) a3=2*a1-a2 a4=VolumeAdjustedAverage[x1](a3) if barindex < x1 then b1=average[x1](close) else b1=(b1[1]*(x1-1)+close)/x1 endif a5=2*a4*b1/(a4+b1) //-----------------------------------------------------// //-----Buy and Sell Signals----------------------------// //-----------------------------------------------------// buysignal=a5<=xl and close>b1*(1+bpt*0.01) sellsignal=a5>=xh and close<b1*(1-spt*0.01) if buysignal then xs=1 elsif sellsignal then xs=-1 else xs=xs[1] endif //-----------------------------------------------------// //-----Plot--------------------------------------------// //-----------------------------------------------------// //Color Candles if xs=1 and colorcandles then drawcandle(open,high,low,close)coloured("cyan",100) elsif xs=-1 and colorcandles then drawcandle(open,high,low,close)coloured("fuchsia",100) endif //Plot Signals if buysignal and xs<>xs[1] and close>st and drawsignals then drawtext("STRONG BUY",barindex,low-tr)coloured("green") drawtext("▲",barindex,low-0.25*tr)coloured("green") elsif buysignal and xs<>xs[1] and drawsignals then drawtext("BUY",barindex,low-tr)coloured("green") drawtext("▲",barindex,low-0.25*tr)coloured("green") elsif sellsignal and xs<>xs[1] and close<st and drawsignals then drawtext("STRONG SELL",barindex,high+tr)coloured("red") drawtext("▼",barindex,high+0.25*tr)coloured("red") elsif sellsignal and xs<>xs[1] and drawsignals then drawtext("SELL",barindex,high+tr)coloured("red") drawtext("▼",barindex,high+0.25*tr)coloured("red") endif //Plot EMAs if drawemas then ema200=average[200,1](close) ema50=average[50,1](close) ema20=average[20,1](close) else ema200=undefined ema50=undefined ema20=undefined endif //Plot Supertrend if drawsupertrend and close>st then r=0 g=255 a=255 a2=100 elsif drawsupertrend and close<=st then r=255 g=0 a2=100 else a=0 a2=0 endif colorbetween(close,st,"fuchsia",a2) //-----------------------------------------------------// return sT as "SuperTrend"coloured(r,g,0,a)style(line,3),ema200 as "EMA 200" style(line,4),ema50 as "EMA 50" style(line,3)coloured("lightblue"),ema20 as "EMA 20" style(line,2)coloured("orange") |
Share this
No information on this site is investment advice or a solicitation to buy or sell any financial instrument. Past performance is not indicative of future results. Trading may expose you to risk of loss greater than your deposits and is only suitable for experienced investors who have sufficient financial means to bear such risk.
ProRealTime ITF files and other attachments :
Find other exclusive trading pro-tools on ![]()
PRC is also on YouTube, subscribe to our channel for exclusive content and tutorials


Hello Ivan, very good job! May I ask you to translate teh script from TradingView named Trendline Pivots [QuantVue] ? It’s very useful!!! Thank you in advance!!!
Hi! yes.
You can ask for it here: https://www.prorealcode.com/free-code-conversion/
Thank you so much Ivan! I created this request in english Translate from TradingView Indicator:Trendline Pivots [QuantVue] , I see many value also in this indicator, thank you anyway in advance!!!
Hello, Is it possible to have a screener for the various buy and sell signals?