







Quadratic Semaphore
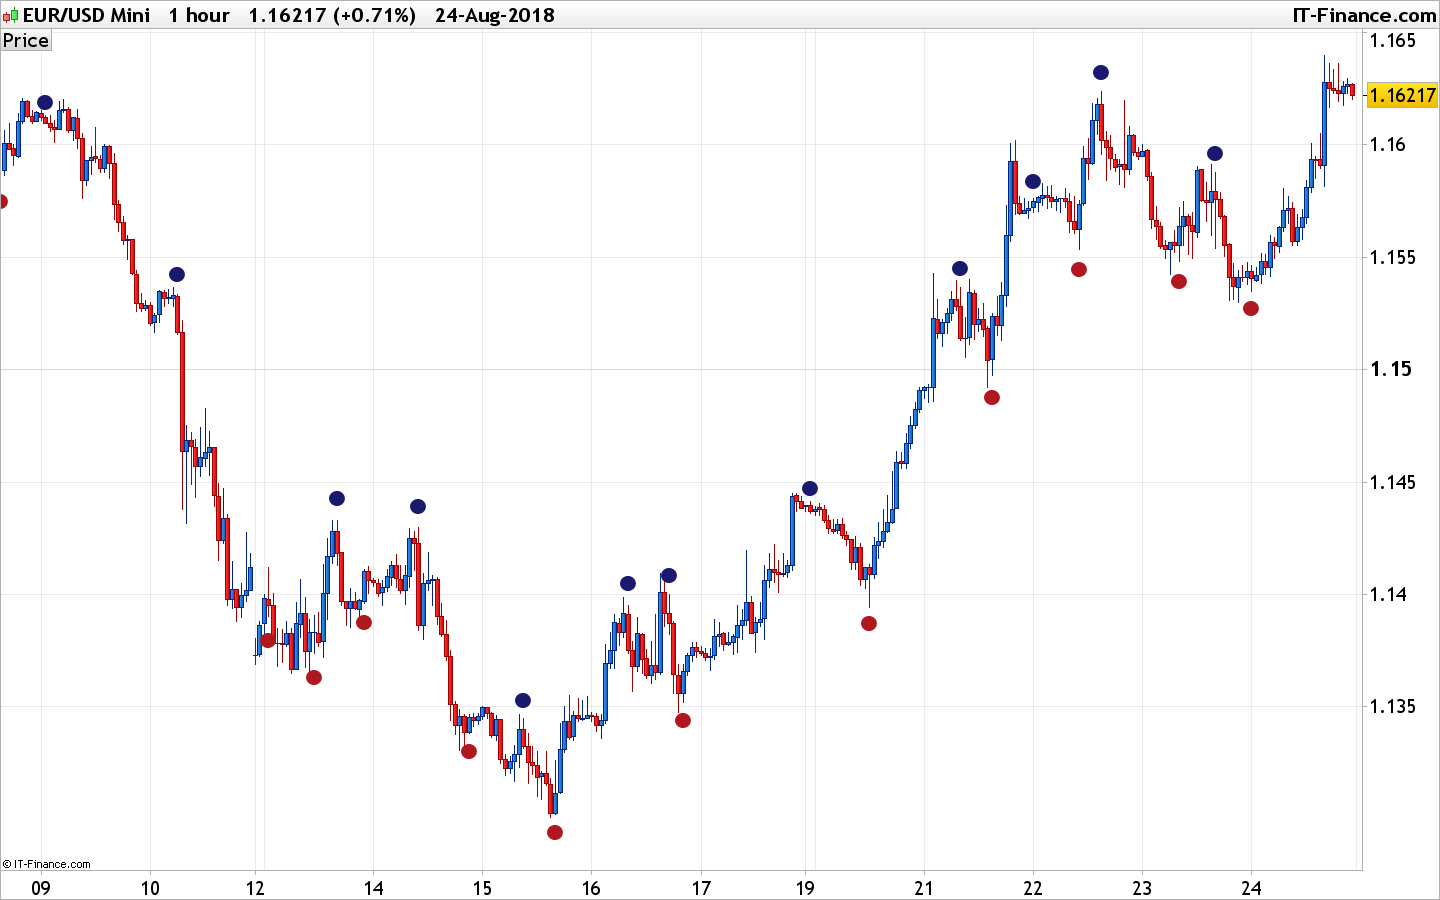
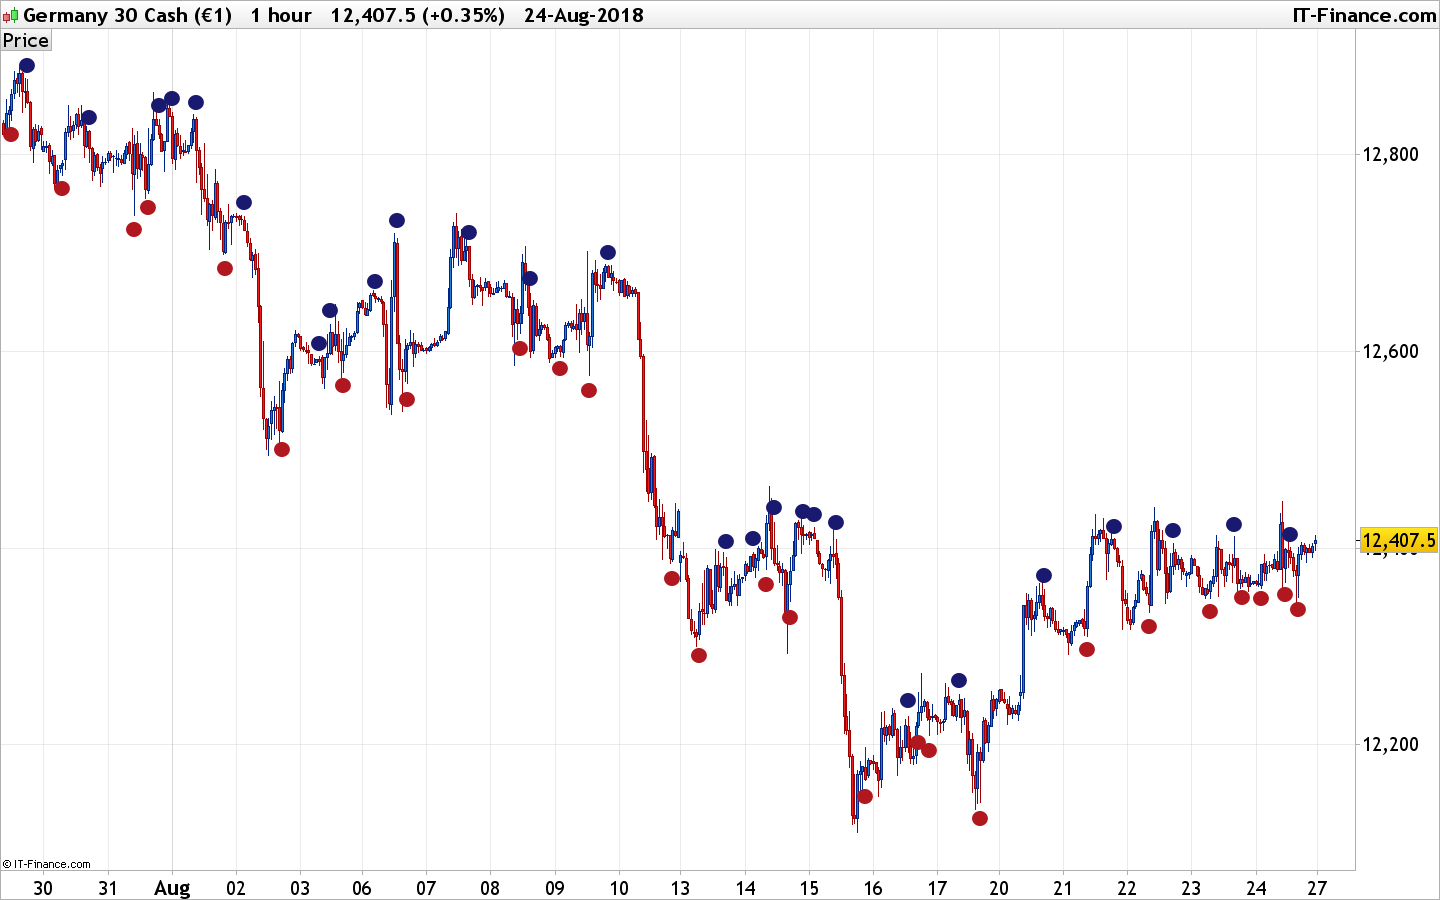
The quadratic semaphore indicator is an indicator that find confirmed market u-turn with the help of 2 quadratic regression calculated with Highs and Lows over the last “length” periods.
“p” setting is candlesticks quantity to confirmed the quadratic regression has formed a High or Low parabola, such as Fractals. Consecutive same signals can happen due to the use of different price values for upper and lower semaphore.
//PRC_Quadratic Semaphore | indicator
//25.08.2018
//Nicolas @ www.prorealcode.com
//Sharing ProRealTime knowledge

// --- settings
length = 30
p=6
// --- end of settings

x1 = barindex
x2 = square(x1)
//upper semaphore
y = high

S11 = summation[length](x2) - square(summation[length](x1))/length
S12 = summation[length](x1*x2) - (summation[length](x1) * summation[length](x2))/length
S22 = summation[length](square(x2)) - square(summation[length](x2))/length
Sy1 = summation[length](y*x1) - (summation[length](y)*summation[length](x1))/length
Sy2 = summation[length](y*x2) - (summation[length](y)*summation[length](x2))/length

max1 = average[length](x1)
max2 = average[length](x2)
may = average[length](y)
b2 = ((Sy1 * S22) - (Sy2*S12))/(S22*S11 - square(S12))
b3 = ((Sy2 * S11) - (Sy1 * S12))/(S22 * S11 - square(S12))
b1 = may - b2*max1 - b3*max2
qr = b1 + b2*x1 + b3*x2

//lower semaphore
yl = low

Sy1l = summation[length](yl*x1) - (summation[length](yl)*summation[length](x1))/length
Sy2l = summation[length](yl*x2) - (summation[length](yl)*summation[length](x2))/length

mayl = average[length](yl)
b2l = ((Sy1l * S22) - (Sy2l*S12))/(S22*S11 - square(S12))
b3l = ((Sy2l * S11) - (Sy1l * S12))/(S22 * S11 - square(S12))
b1l = mayl - b2l*max1 - b3l*max2
qrl = b1l + b2l*x1 + b3l*x2

period = round(p/2)+1
hh = qr[period]
ll = qrl[period]
countH = 0
countL = 0
for i = 1 to period-1 do
 if qr[i]<hh then
  countH=countH+1
 endif
 if qrl[i]>ll then
  countL=countL+1
 endif
next
for i = period+1 to p+1 do
 if qr[i]<hh then
  countH=countH+1
 endif
 if qrl[i]>ll then
  countL=countL+1
 endif
next
atr = averagetruerange[length]
if countH=p then
 pivotH = high[period]
 drawtext("●",barindex[period],pivotH+atr/2,dialog,bold,20) coloured(25,25,112)
endif
if countL=p then
 pivotL = low[period]
 drawtext("●",barindex[period],pivotL-atr/2,dialog,bold,20) coloured(176,23,31)
endif

return
Comments
You must be logged in to post a comment.

Hi Nicolas Thanks a lot for the indicator. Trading off the TradingView and have issues with the scanner based on this indicator. TradingView is not allowing to use custom scripts to scan the whole market. Only limited mount of stocks (based on subscription). So, trying to converto to Python, but there is a wall - it's not possible to get the same results in Python as on TV for all stocks. The reason of this is that TV uses the bar_index as an input parameter for the quadratic calculations. This differs for each stock based on how long TV has had data for the stock in question. In the Python code, on the other hand, you can't use anything else than a hardcoded value for bar_index. Please advise if you can suggest how to scan the market with this indicator? Thanks in advance for your suggestions. P.S. Open to communicate in person

Dear Sir, Can I get MQL4 File for this indicator and last man standing . pls looking forward for your valuable reply.

Bonjour Nicolas Je cherche à créer un screener avec cet indicateur lorsque un point bas apparait( rond rouge) Peux-tu m'aider merci

Buenas tardes,me gustaria saber si tiene un proscreener de este indicador ,que busque los valores que marcan giro de mercado

I like the look of this. I shall try it tomorrow.

Bonjour Nicolas, thanks for this genius contribution and all the best for 2019. I really like this indicator because it combines the powerful Regression and Williams Fractals concepts. Since I don’t know how to use this indicator in an automated scalping strategy, I would appreciate it very much if you could advise how to do this in more detail (see question from „verybrubby“)? At least it would be great to understand how I can implement an acoustic signal („beep/bell“) in addition to the plot in the chart. I know how to define Alerts in PRT (https://www.prorealcode.com/blog/video-tutorials/alerts-prorealtime-10-3/) but using an indicator-based alert would be much more flexible. Thanks a lot in advance and kind regards!

Thanks for this Nicolas... so, can this indicator be used in a strategy? eg using the dots as signals to buy/sell? I cant seem to work out how to use it in that way... thanks again



excellent, a guy is using something like this on instragram and trying ot sell it as a wallstreet quant indicator