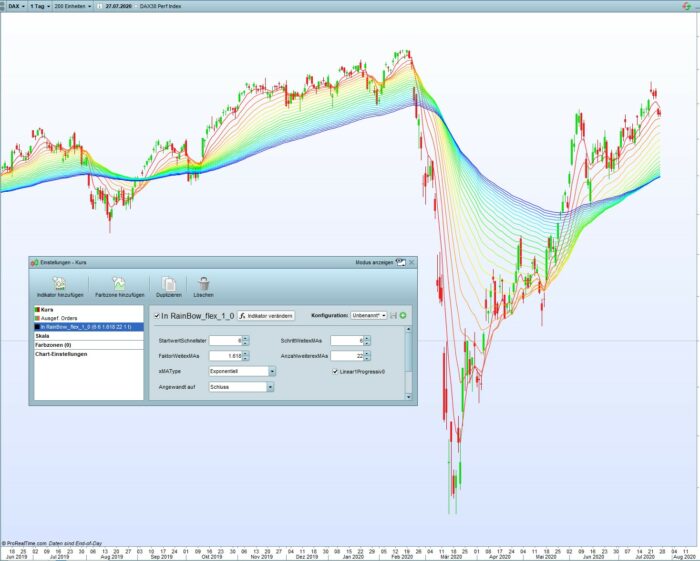
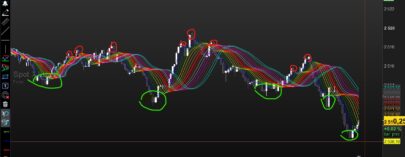
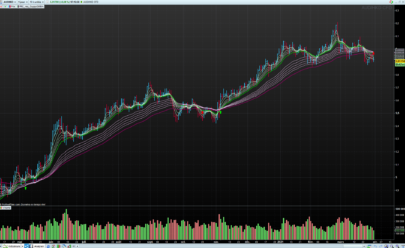
Before switching to non-linear distances, reduce “step width exMAs” to values less than 10
With the settings:
- “StartwertSchastest” a Fibo number,
- “FactorMorexMAs”: 1.618 and
- “Lineaer1Progressiv0”: wrong
MAs arise whose period durations are Fibo numbers
ProRealTime v11 only compatible
|
1 2 3 4 5 6 7 8 9 10 11 12 13 14 15 16 17 18 19 20 21 22 23 24 25 26 27 28 29 30 31 32 33 34 35 36 37 38 39 40 41 42 43 44 45 46 47 48 49 50 51 52 53 54 55 56 57 58 59 60 61 |
// RainBow - Indikator // // Übergabe der Variablen prdxMA1 = StartwertSchnellster // 3 (Fibo-Zahl für Fibo-xMAs) stpxMAs = SchrittWeitexMAs // 3 (gültig für lineare Berechnunge fktxMAs = FaktorWeitexMAs // 1.6188 (gültig für exponetielle Berechnung; 1.618 entspricht Fibo-Ratio) numxMAs = AnzahlweiterexMAs // 22 max 9 bei exponentiellen Abstand (Berechnungszeit!!!) typxMAs = xMAType // 1 artBerchg = Linear1Progressiv0 // Linearer Abstand : 1 ; Exponetieller Abstand: 0 MyClose = CustomClose // // Bestücken des Arrys $prdxMA[0] = prdxMA1 if artBerchg = 1 then // Perioden für linearen Abstand for i = 1 to numxMAs $prdxMA[i] = $prdxMA[i - 1] + stpxMAs next else // artBerchg = 0 then // Perioden für wachsenden Abstand for i = 1 to numxMAs $prdxMA[i] = round($prdxMA[i - 1] * fktxMAs) next endif // // Berechnung Farbverlauf $FarbeRot[0] = 255 $FarbeGruen[0] = 0 $FarbeBlau[0] = 0 ratio = 1 / numxMAs IF numxMAs > 1 Then For k = 1 To numxMAs if ratio * k <= 0.25 then $FarbeRot[k] = 255 $FarbeGruen[k] = 255 * 4 * k / numxMAs $FarbeBlau[k] = 0 elsif ratio * k > 0.25 and ratio * k <= 0.50 then $FarbeRot[k] = 255 * (2 - 4 * k / numxMAs) $FarbeGruen[k] = 255 $FarbeBlau[k] = 0 elsif ratio * k > 0.50 and ratio * k <= 0.75 then $FarbeRot[k] = 0 $FarbeGruen[k] = 255 $FarbeBlau[k] = 255 * ((4 * k / numxMAs) - 2) elsif ratio * k > 0.27 then $FarbeRot[k] = 0 $FarbeGruen[k] = 255 * (4 - 4 * k / numxMAs ) $FarbeBlau[k] = 255 endif next else break endif // // Berechnen der xMA-Werte for j = 0 to numxMAs $MYxMA [j] = Average[$prdxMA[j],typxMAs](MyClose) $MYxMA1[j] = Average[$prdxMA[j],typxMAs](MyClose[1]) DRAWSEGMENT(barindex, $MYxMA[j], barindex[1], $MYxMA1[j])COLOURED($FarbeRot[j],$FarbeGruen[j],$FarbeBlau[j]) next // RETURN |
Share this
No information on this site is investment advice or a solicitation to buy or sell any financial instrument. Past performance is not indicative of future results. Trading may expose you to risk of loss greater than your deposits and is only suitable for experienced investors who have sufficient financial means to bear such risk.
ProRealTime ITF files and other attachments :PRC is also on YouTube, subscribe to our channel for exclusive content and tutorials






bonsoir je suis débutant , super indicateur , je n arrive pas à le positionner sur le graphique comment faire ? svp
Il faut l’ajouter sur le prix avec l’icône de la clé situé en haut à gauche du graphique du prix.
merci de ta réponse
bonjour c est bon il fonctionne parfaitement merci beaucoup