




More from ProRealCode
ProRealCode - Trading & Coding with ProRealTime™
The ProRealTime™ community on the web! Officially sharing ProRealTime knowledge to Worldwide users since 2015!



RainBow – indicator for visual analysis
August 10, 2020, 10:24 AM
Indicators
4 Comments
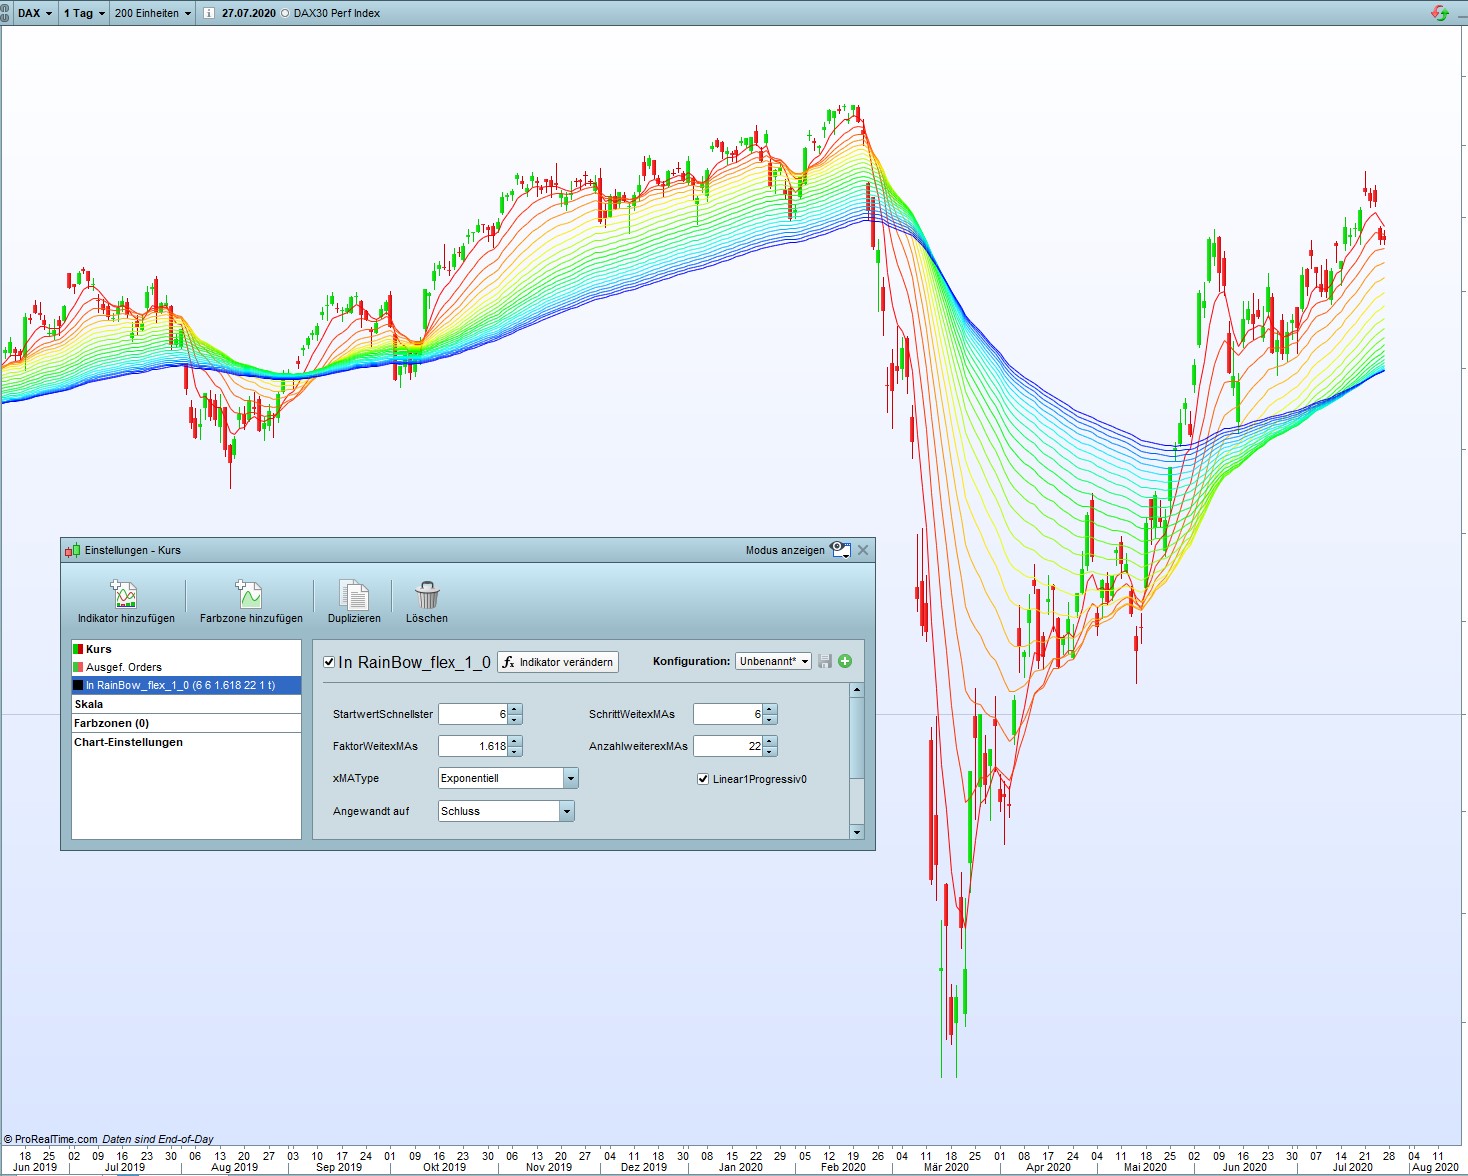
Before switching to non-linear distances, reduce “step width exMAs” to values less than 10
With the settings:
- “StartwertSchastest” a Fibo number,
- “FactorMorexMAs”: 1.618 and
- “Lineaer1Progressiv0”: wrong
MAs arise whose period durations are Fibo numbers
ProRealTime v11 only compatible
// RainBow - Indikator
//
// Übergabe der Variablen
prdxMA1   = StartwertSchnellster  //   3      (Fibo-Zahl für Fibo-xMAs)
stpxMAs   = SchrittWeitexMAs      //   3      (gültig für lineare Berechnunge
fktxMAs   = FaktorWeitexMAs       //   1.6188 (gültig für exponetielle Berechnung; 1.618 entspricht Fibo-Ratio)
numxMAs   = AnzahlweiterexMAs     //   22     max 9 bei exponentiellen Abstand (Berechnungszeit!!!)
typxMAs   = xMAType               //   1
artBerchg = Linear1Progressiv0    //   Linearer Abstand : 1 ; Exponetieller Abstand: 0
MyClose   = CustomClose
//
// Bestücken des Arrys
$prdxMA[0] = prdxMA1
if artBerchg = 1 then      // Perioden für linearen Abstand
 for i = 1 to numxMAs
  $prdxMA[i] = $prdxMA[i - 1] + stpxMAs
 next
else // artBerchg = 0 then   // Perioden für wachsenden Abstand
 for i = 1 to numxMAs
  $prdxMA[i] = round($prdxMA[i - 1] * fktxMAs)
 next
endif

//
// Berechnung Farbverlauf
$FarbeRot[0]   = 255
$FarbeGruen[0] =   0
$FarbeBlau[0]  =   0
ratio = 1 / numxMAs
IF numxMAs > 1 Then
 For k = 1 To numxMAs
  if ratio * k <= 0.25 then
   $FarbeRot[k]   = 255
   $FarbeGruen[k] = 255 * 4 * k  / numxMAs
   $FarbeBlau[k]  =   0
  elsif ratio * k > 0.25 and ratio * k <= 0.50 then
   $FarbeRot[k]   = 255 * (2 - 4 * k / numxMAs)
   $FarbeGruen[k] = 255
   $FarbeBlau[k]  =   0
  elsif ratio * k > 0.50 and ratio * k <= 0.75 then
   $FarbeRot[k]   =   0
   $FarbeGruen[k] = 255
   $FarbeBlau[k]  = 255 * ((4 * k / numxMAs) - 2)
  elsif  ratio * k > 0.27  then
   $FarbeRot[k]   =   0
   $FarbeGruen[k] = 255 * (4 - 4 * k / numxMAs )
   $FarbeBlau[k]  = 255
  endif
 next
else
 break
endif
//
// Berechnen der xMA-Werte
for j = 0 to numxMAs
 $MYxMA [j] = Average[$prdxMA[j],typxMAs](MyClose)
 $MYxMA1[j] = Average[$prdxMA[j],typxMAs](MyClose[1])
 DRAWSEGMENT(barindex, $MYxMA[j], barindex[1], $MYxMA1[j])COLOURED($FarbeRot[j],$FarbeGruen[j],$FarbeBlau[j])
next
//
RETURN
Download
Filename:
In-RainBow-mod.itf
Downloads:
179
Junior
This author is like an anonymous function, present but not directly identifiable. More details on this code architect as soon as they exit 'incognito' mode.
Author’s Profile
Similar code
Fishnet Moving Averages with stepIndicators
Guppy IndicatorIndicators
Guppy’s CBL (Count Back Line)Indicators
Multi-Indicator Signal EngineIndicators


Loading...
bonjour c est bon il fonctionne parfaitement merci beaucoup