The Rainbow Oscillator indicator was created by Mel widner in 1997, published in the magazine Stocks and Commodities.
This indicator is the adaptation of a code of the Tradingview platform:
Ever since the people concluded that stock market price movements are not random or chaotic, but follow specific trends that can be forecasted, they tried to develop different tools or procedures that could help them identify those trends. And one of those financial indicators is the Rainbow Oscillator Indicator. The Rainbow Oscillator Indicator is relatively new, originally introduced in 1997, and it is used to forecast the changes of trend direction.
As market prices go up and down, the oscillator appears as a direction of the trend, but also as the safety of the market and the depth of that trend. As the rainbow grows in width, the current trend gives signs of continuity, and if the value of the oscillator goes beyond 80, the market becomes more and more unstable, being prone to a sudden reversal. When prices move towards the rainbow and the oscillator becomes more and more flat, the market tends to remain more stable and the bandwidth decreases. Still, if the oscillator value goes below 20, the market is again, prone to sudden reversals. The safest bandwidth value where the market is stable is between 20 and 80, in the Rainbow Oscillator indicator value.
The depth a certain price has on a chart and into the rainbow can be used to judge
the strength of the move.
|
1 2 3 4 5 6 7 8 9 10 11 12 13 14 15 16 17 18 19 20 21 22 23 24 25 26 27 28 29 30 31 32 33 34 35 36 37 38 39 40 41 42 43 44 45 46 47 48 49 50 51 52 53 54 55 56 |
REM RAINBOW OSCILLATOR //@version=2 //by HPotter on platform Tradingview //adapted for the Prorealtime platform by bolsatrilera // Copyright by HPotter v1.0 07/03/2018 // Ever since the people concluded that stock market price movements are not // random or chaotic, but follow specific trends that can be forecasted, they // tried to develop different tools or procedures that could help them identify // those trends. And one of those financial indicators is the Rainbow Oscillator // Indicator. The Rainbow Oscillator Indicator is relatively new, originally // introduced in 1997, and it is used to forecast the changes of trend direction. // // As market prices go up and down, the oscillator appears as a direction of the // trend, but also as the safety of the market and the depth of that trend. As // the rainbow grows in width, the current trend gives signs of continuity, and // if the value of the oscillator goes beyond 80, the market becomes more and more // unstable, being prone to a sudden reversal. When prices move towards the rainbow // and the oscillator becomes more and more flat, the market tends to remain more // stable and the bandwidth decreases. Still, if the oscillator value goes below 20, // the market is again, prone to sudden reversals. The safest bandwidth value where // the market is stable is between 20 and 80, in the Rainbow Oscillator indicator value. // The depth a certain price has on a chart and into the rainbow can be used to judge // the strength of the move. //////////////////////////////////////////////////////////// Length = 2 LengthHHLL = 10 //title="HHV/LLV Lookback") xMA1 = Average[Length](close) xMA2 =Average[Length](xMA1) xMA3 =Average[Length](xMA2) xMA4 =Average[Length](xMA3) xMA5 =Average[Length](xMA4) xMA6 = Average[Length](xMA5) xMA7 =Average[Length](xMA6) xMA8 =Average[Length](xMA7) xMA9 =Average[Length](xMA8) xMA10 =Average[Length](xMA9) xHH = highest[LengthHHLL](close) xLL = lowest [LengthHHLL](close) xHHMAs = max(xMA1,max(xMA2,max(xMA3,max(xMA4,max(xMA5,max(xMA6,max(xMA7,max(xMA8,max(xMA9,xMA10))))))))) xLLMAs = min(xMA1,min(xMA2,min(xMA3,min(xMA4,min(xMA5,min(xMA6,min(xMA7,min(xMA8,min(xMA9,xMA10))))))))) xRBO = 100 * ((close - ((xMA1+xMA2+xMA3+xMA4+xMA5+xMA6+xMA7+xMA8+xMA9+xMA10) / 10)) / (xHH - xLL)) xRB = 100 * ((xHHMAs - xLLMAs) / (xHH - xLL)) if xRBO >=0 then r=34 g=139 b=34 else r=255 g=0 b=0 endif return xRBO coloured(r,g,b)style(histogram)as "RO", 0 coloured (128,128,128)as "0",xRB coloured(34,139,34)as "RB", -xRB coloured (255,0,0) as "RB" |
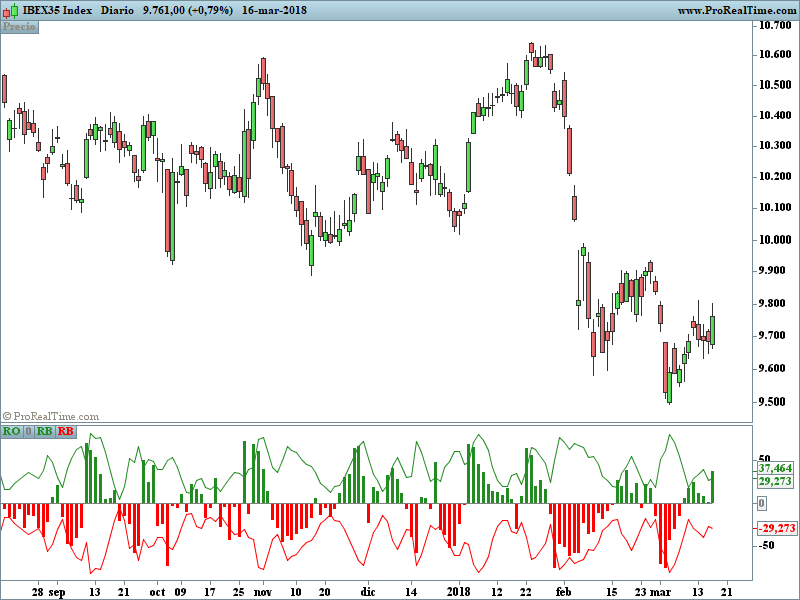
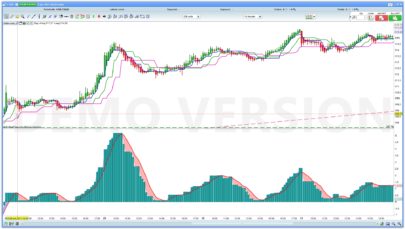
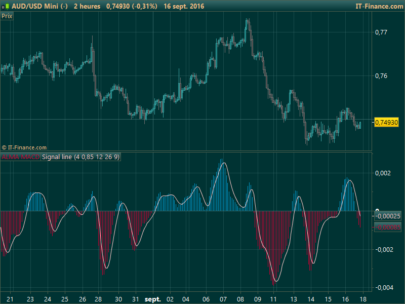
It is a trend indicator.
It consists of some lines that form bands (RB) and histograms (RO)
- If RO is positive and the amplitude of RB when the movement starts is not very large (it is between 30% and 60%), we will say that the market is bullish .
- If RO is negative and the amplitude of RB when the movement starts is not very big (it is between 30% and 60%), we will say that the market is bearish.
Share this
No information on this site is investment advice or a solicitation to buy or sell any financial instrument. Past performance is not indicative of future results. Trading may expose you to risk of loss greater than your deposits and is only suitable for experienced investors who have sufficient financial means to bear such risk.
ProRealTime ITF files and other attachments :
Find other exclusive trading pro-tools on ![]()
PRC is also on YouTube, subscribe to our channel for exclusive content and tutorials


Interesting, thanks! Combine this indicator with the bollinger bands there is enough to make beautiful things 🙂