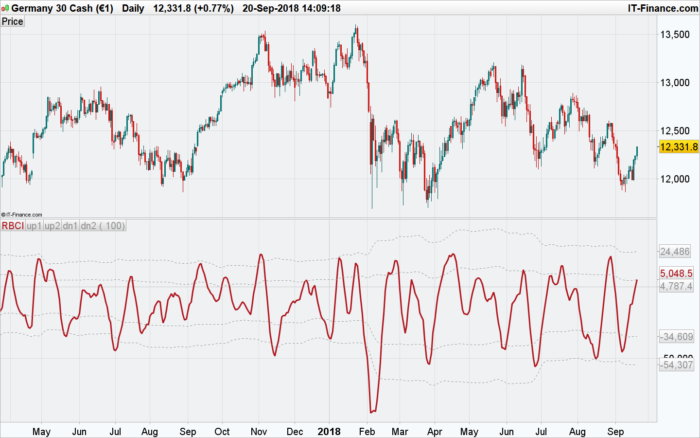
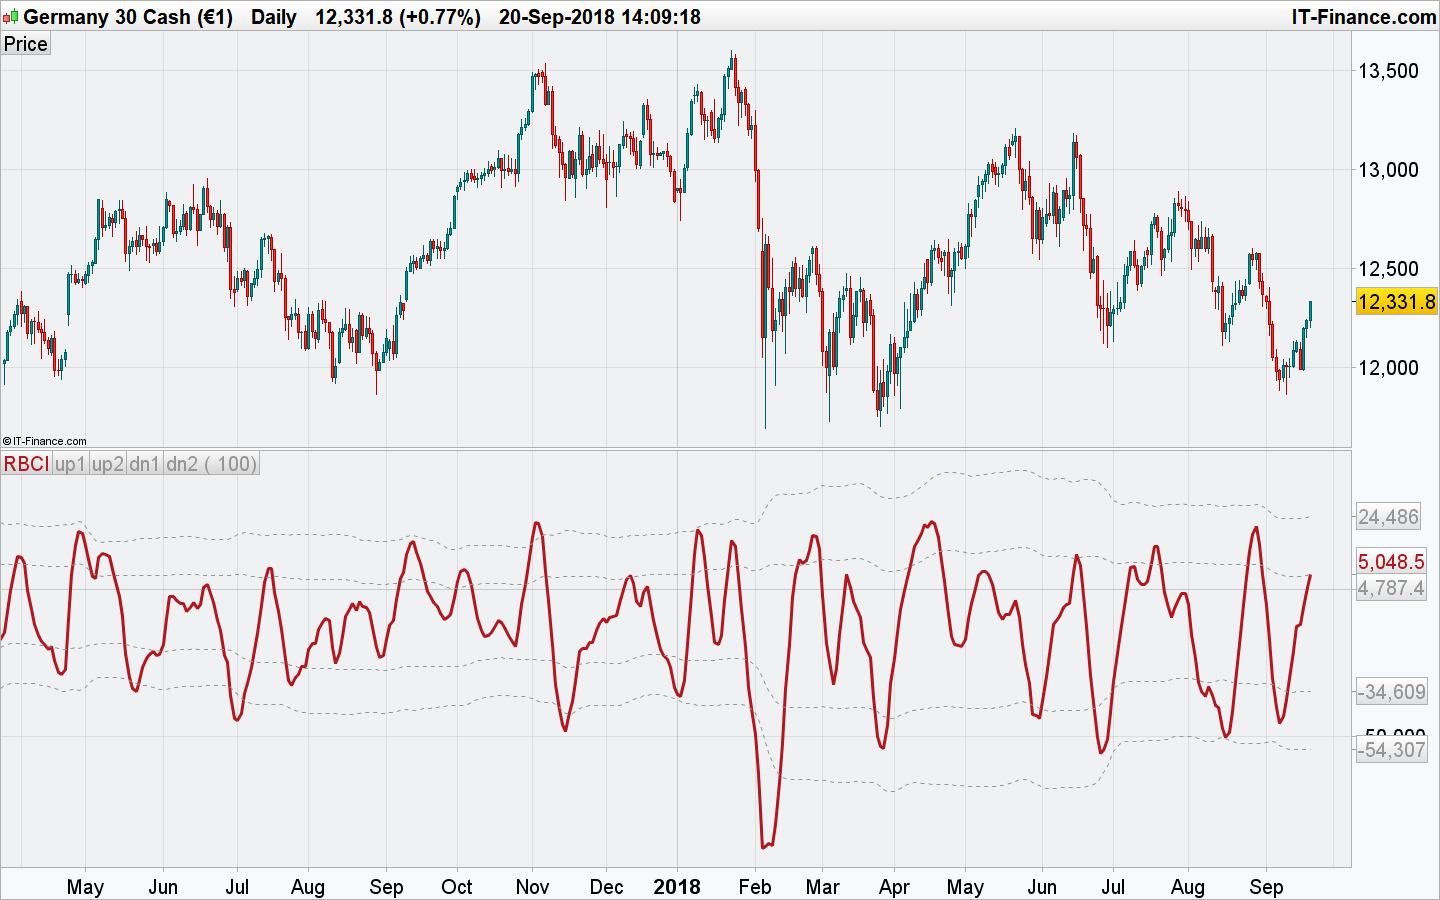
Range Bound Channel Index (RBCI) is calculated by means of the channel (bandwidth) filter (CF).
Channel filter simultaneously fulfills two functions: removes low frequent trend formed by low frequent components of the spectrum; removes high frequency noise formed by the high frequent components of the spectrum.
When RBCI approaches its local maximum the prices approach upper border of the trading channel and when RBCI approach its local minimum the prices approach the lower border of the trading corridor. Let’s mark main property of RBCI index. This is quasi stationary (that is almost stationary) process bound by the frequency range both from above and below.
(New Adaptive Method of Following the Tendency and Market Cycles by Vladimir Kravchuk)
|
1 2 3 4 5 6 7 8 9 10 11 12 13 14 15 16 17 18 19 20 21 |
//PRC_RBCI | indicator //20.09.2018 //Nicolas @ www.prorealcode.com //Sharing ProRealTime knowledge // --- settings BBPeriod=100 //Period for Bollinger levels // --- end of settings price = customclose RBCI=-35.524181940 * price[0]-29.333989650 * price[1]-18.427744960 * price[2]-5.3418475670 * price[3]+7.0231636950 * price[4]+16.176281560 * price[5]+20.656621040 * price[6]+20.326611580 * price[7]+16.270239060 * price[8]+10.352401270 * price[9]+4.5964239920 * price[10]+0.5817527531 * price[11]-0.9559211961 * price[12]-0.2191111431 * price[13]+1.8617342810 * price[14]+4.0433304300 * price[15]+5.2342243280 * price[16]+4.8510862920 * price[17]+2.9604408870 * price[18]+0.1815496232 * price[19]-2.5919387010 * price[20]-4.5358834460 * price[21]-5.1808556950 * price[22]-4.5422535300 * price[23]-3.0671459820 * price[24]-1.4310126580 * price[25]-0.2740437883 * price[26]+0.0260722294 * price[27]-0.5359717954 * price[28]-1.6274916400 * price[29]-2.7322958560 * price[30]-3.3589596820 * price[31]-3.2216514550 * price[32]-2.3326257940 * price[33]-0.9760510577 * price[34]+0.4132650195 * price[35]+1.4202166770 * price[36]+1.7969987350 * price[37]+1.5412722800 * price[38]+0.8771442423 * price[39]+0.1561848839 * price[40]-0.2797065802 * price[41]-0.2245901578 * price[42]+0.3278853523 * price[43]+1.1887841480 * price[44]+2.0577410750 * price[45]+2.6270409820 * price[46]+2.6973742340 * price[47]+2.2289941280 * price[48]+1.3536792430 * price[49]+0.3089253193 * price[50]-0.6386689841 * price[51]-1.2766707670 * price[52]-1.5136918450 * price[53]-1.3775160780 * price[54]-1.6156173970 * price[55] avg = average[BBperiod](RBCI) dev = std[BBperiod](RBCI) up1 = avg+dev up2 = avg+dev*2 dn1 = avg-dev dn2 = avg-dev*2 RETURN -RBCI coloured(176,23,31) style(line,3) as "RBCI", -up1 coloured(150,150,150) style(dottedline) as "up1", -up2 coloured(150,150,150) style(dottedline) as "up2", -dn1 coloured(150,150,150) style(dottedline) as "dn1", -dn2 coloured(150,150,150) style(dottedline) as "dn2" |
Share this
No information on this site is investment advice or a solicitation to buy or sell any financial instrument. Past performance is not indicative of future results. Trading may expose you to risk of loss greater than your deposits and is only suitable for experienced investors who have sufficient financial means to bear such risk.
ProRealTime ITF files and other attachments :PRC is also on YouTube, subscribe to our channel for exclusive content and tutorials


no me sale nada
si me salio grafico
¿Lo siento? ¿Cuál es tu problema con este indicador?
Bonjour Nicolas
Merci pour votre indicateur.
Avez-vous codé les autres indicateurs publiés dans le papier de Vladimir Kravchuk : FATL, SATL, RFTL, RSTL, … ?
Très cordialement,
Nicolas
Je viens de retrouver un post très intéressant de laurenzo mentionant ces indicateurs :
https://www.prorealcode.com/reply/37982/
En effet, je pense qu’ils sont présents dans cet indicateur de notre bibliothèque de codes pour ProRealTime: https://www.prorealcode.com/prorealtime-indicators/average-filter-regression/