







Range filter
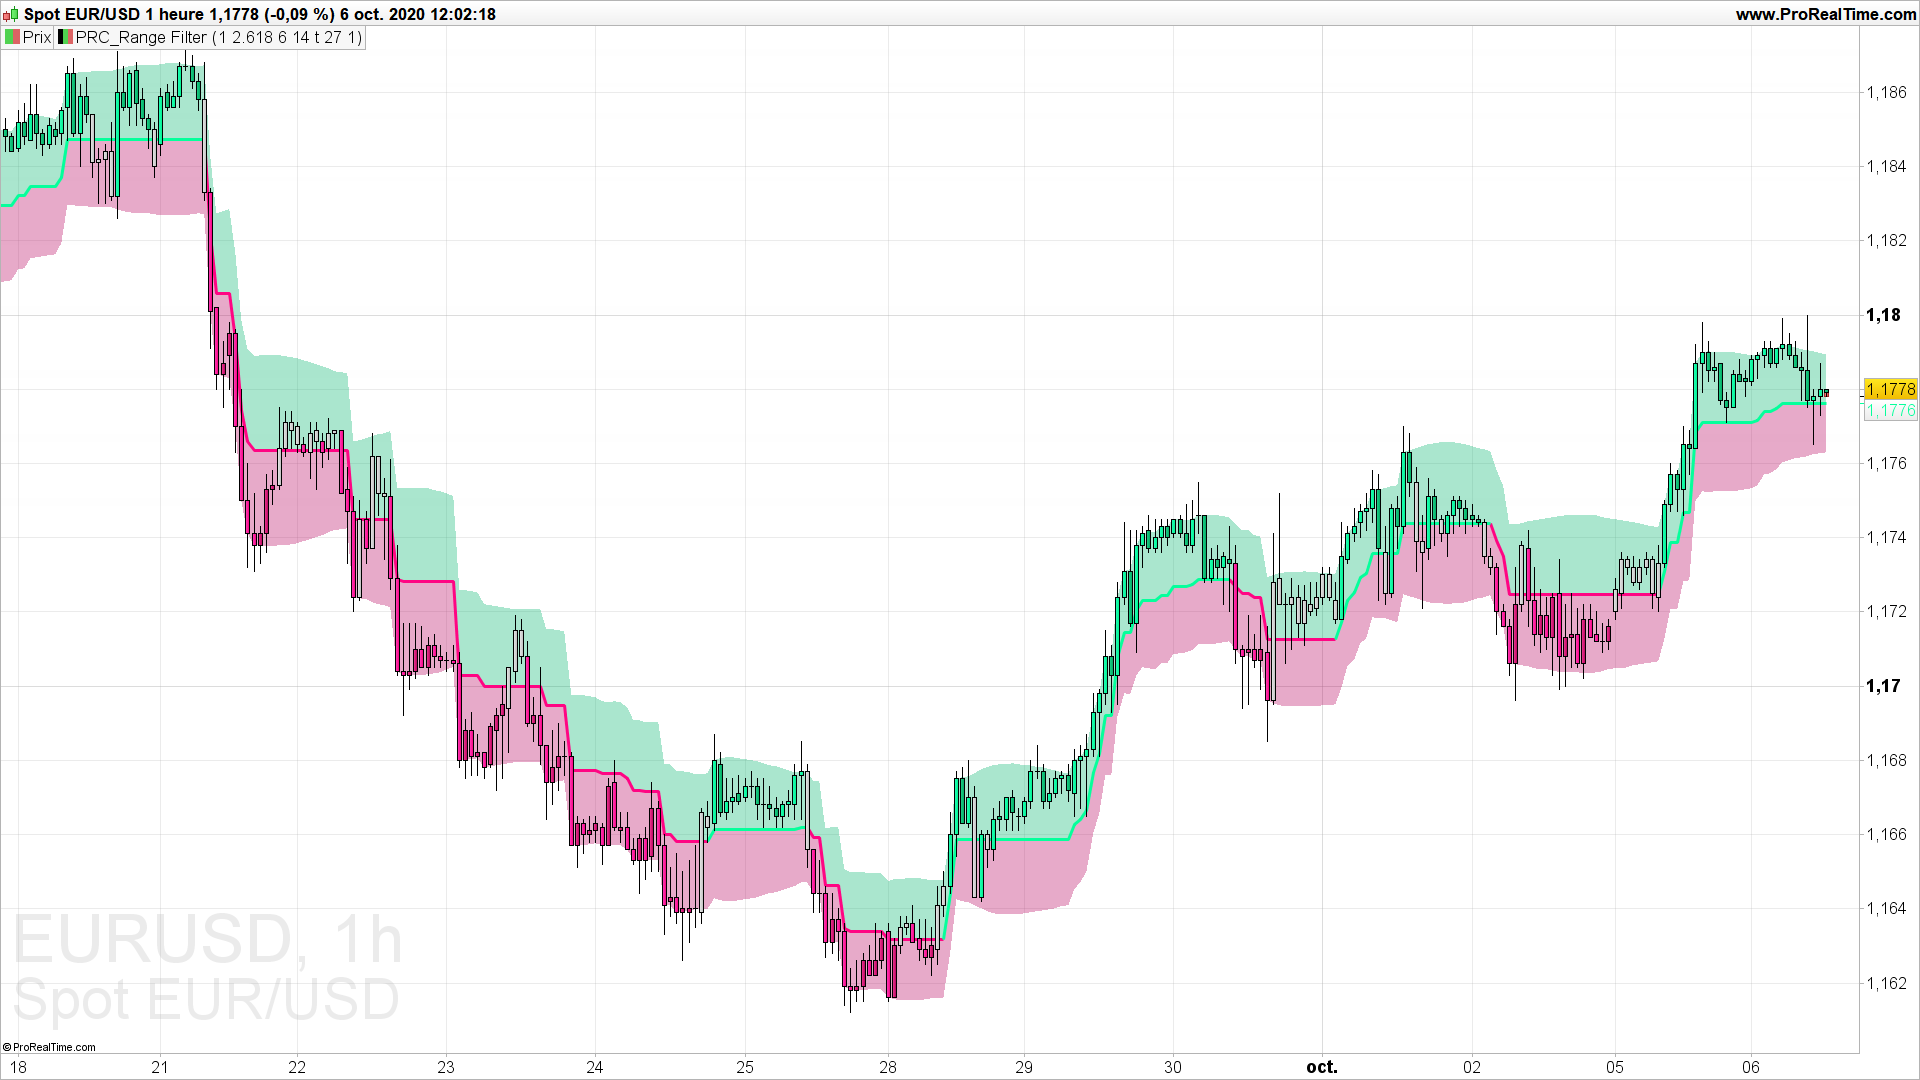
Inspired by the QQE’s volatility filter, this filter applies the process directly to price rather than to a smoothed RSI.
This is an experimental study designed to filter out minor price action for a clearer view of trends.
First, a smooth average price range is calculated for the basis of the filter and multiplied by a specified amount.
Next, the filter is calculated by gating price movements that do not exceed the specified range.
Lastly the target ranges are plotted to display the prices that will trigger filter movement.
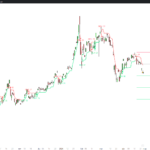
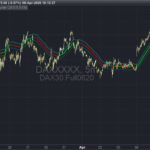
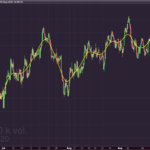
Custom bar colors are included. The color scheme is based on the filtered price trend.
Select the type you want to use via the “Filter Type” input. Type 1 is the original formula.
Multiple range sizing methods are available. You can choose from the following scales:
- Points
- Pips (Works best with forex pairs, obviously)3
- Ticks4
- % of Price
- ATR
- Average Change (Default. This is the original sizing method.)
- Standard Deviation
Range smoothing is optional, and you can specify your smoothing length. Smoothing only affects dynamic scales (ATR, Average Change, and Standard Deviation).
Filter movement can be determined using wicks or close. This can be specified via the “Movement Source” input.
(description from the original author of this indicator: Donowan Wall, all credits go to him).
//PRC_Range Filter | indicator
//06.10.2020
//Nicolas @ www.prorealcode.com
//Sharing ProRealTime knowledge

// --- settings
ftype = 1 //Filter Type (1 or 2?)
rngqty   = 2.618 //Range Size
rngscale = 6 //Range Scale (1=Points, 2=Pips, 3=Ticks, 4=% of Price, 5=ATR, 6=Average Change, 7=Standard Deviation
rngper = 14 //Range Period (for ATR, Average Change, and Standard Deviation)
smoothrange = 1 //Smooth Range (0=false ; 1=true)
smoothper   = 27 //Smoothing Period
movsrc = 1  //Movement Source (0=Wicks, 1=Close)
//--- end of settings

once rngfilt=close
if barindex>max(rngper,smoothper) then
 //Range Size Function
 rngscale=max(1,min(rngscale,7))
 if rngscale=1 then
  scale = rngqty*pointsize
 elsif rngscale=2 then
  scale = rngqty*.0001
 elsif rngscale=3 then
  scale = rngqty*ticksize
 elsif rngscale=4 then
  scale = close*rngqty/100
 elsif rngscale=5 then
  scale = rngqty*average[rngper,1](tr)
 elsif rngscale=6 then
  scale = rngqty*average[rngper,1](abs(close-close[1]))
 elsif rngscale=7 then
  scale = STD[rngper](close)
 endif

 if smoothrange then
  r=average[smoothper,1](scale)
 else
  r=scale
 endif

 hh=close
 ll=close
 if movsrc<>1 then
  hh=high
  ll=low
 endif
  if ftype=1 then
   if hh>rngfilt[1] then
    if (hh-r)<rngfilt[1] then
     rngfilt=rngfilt[1]
    else
     rngfilt=hh-r
    endif
  elsif (ll+r)>rngfilt[1] then
   rngfilt=rngfilt[1]
  else
   rngfilt=ll+r
  endif
 else //ftype<>1
  if hh>=rngfilt[1]+r then
   rngfilt=(rngfilt[1]) + floor(abs(hh - (rngfilt[1]))/r)*r
  elsif ll<=rngfilt[1]-r then
   rngfilt=(rngfilt[1]) - floor(abs(ll - (rngfilt[1]))/r)*r
 else
  rngfilt=rngfilt[1]
 endif
endif

hiband    = rngfilt + r
loband    = rngfilt - r

if rngfilt>rngfilt[1] then
 upward=1
 downward=0
endif
if rngfilt<rngfilt[1] then
 upward=0
 downward=1
endif

 //Direction Conditions & colors
 if upward then
  cr=5
  cg=255
  cb=155
 endif
 if downward then
  cr=255
  cg=5
  cb=131
 endif

 if (close > rngfilt) and (close > (close[1])) and (upward > 0) then
  br=5
  bg=255
  bb=155
  //#05ff9b
 elsif (close > rngfilt) and (close <= (close[1])) and (upward > 0) then
  br=0
  bg=179
  bb=107
  //#00b36b
 elsif (close < rngfilt) and (close < (close[1])) and (downward > 0) then
  br=255
  bg=5
  bb=131
  //#ff0583
 elsif (close < rngfilt) and (close >= (close[1])) and (downward > 0) then
  br=184
  bg=0
  bb=93
  //#b8005d
 else
  br=204
  bg=204
  bb=204
 endif
 drawcandle(open,high,low,close) coloured(br,bg,bb) bordercolor(0,0,0)

 //Band Fills
 drawtriangle(barindex[1],hiband[1],barindex,rngfilt,barindex[0],hiband[0]) coloured(0,179,107,85) bordercolor(0,179,107,0)
 drawtriangle(barindex[1],hiband[1],barindex[1],rngfilt[1],barindex[0],rngfilt[0]) coloured(0,179,107,85) bordercolor(0,179,107,0)
 drawtriangle(barindex[1],loband[1],barindex,rngfilt,barindex[0],loband[0]) coloured(184,0,93,85) bordercolor(184,0,93,0)
 drawtriangle(barindex[1],loband[1],barindex[1],rngfilt[1],barindex[0],rngfilt[0]) coloured(184,0,93,85) bordercolor(184,0,93,0)
endif


return rngfilt coloured(cr,cg,cb) style(line,3) as "Filter"
Comments
You must be logged in to post a comment.

Bonjour Nicolas, J'ai pas bien compris le principe de fonctionnement de ce range filter indicator ? quelle est la signification de la bougie grise ? Je vois 3 couleurs de bougies possible ( vert, rose et gris ) ! Merci
La définition des couleurs se situent entre les lignes 94 et 118. Selon le type de bougie (haussière ou baissière), si elle situe dessus/dessous de la ligne centrale (le range filter) et si cette dernière est ascendante ou descendante. Je ne suis pas l'auteur de cet indicateur, j'ai réalisé une conversion de code suite à une demande.



if hh>rngfilt[1] then if (hh-r)rngfilt[1] then rngfilt=rngfilt[1] else rngfilt=ll+r endif else //ftype1 if hh>=rngfilt[1]+r then rngfilt=(rngfilt[1]) + (abs(hh - (rngfilt[1]))/r)*r elsif llrngfilt[1] then upward=1 downward=0 endif if rngfilt rngfilt) and (close > (close[1])) and (upward > 0) then br=5 bg=255 bb=155 //#05ff9b elsif (close > rngfilt) and (close 0) then br=0 bg=179 bb=107 //#00b36b elsif (close < rngfilt) and (close 0) then br=255 bg=5 bb=131
Thanks Nicolas, however it is throwing errors as enclosed.
//PRC_Range Filter | indicator //06.10.2020 //Nicolas @ www.prorealcode.com //Sharing ProRealTime knowledge // --- settings //ftype = 1 //Filter Type (1 or 2?) //rngqty = 2.618 //Range Size //rngscale = 6 //Range Scale (1=Points, 2=Pips, 3=Ticks, 4=% of Price, 5=ATR, 6=Average Change, 7=Standard Deviation //rngper = 14 //Range Period (for ATR, Average Change, and Standard Deviation) //smoothrange = 1 //Smooth Range (0=false ; 1=true) //smoothper = 27 //Smoothing Period //movsrc = 1 //Movement Source (0=Wicks, 1=Close) //--- end of settings once rngfilt=close if barindex>max(rngper,smoothper) then //Range Size Function rngscale=max(1,min(rngscale,7)) if rngscale=1 then scale = rngqty*pointsize elsif rngscale=2 then scale = rngqty*.0001 elsif rngscale=3 then scale = rngqty*ticksize elsif rngscale=4 then scale = close*rngqty/100 elsif rngscale=5 then scale = rngqty*average[rngper,1](tr) elsif rngscale=6 then scale = rngqty*average[rngper,1](abs(close-close[1])) elsif rngscale=7 then scale = STD[rngper](close) endif if smoothrange then r=average[smoothper,1](scale) else r=scale endif hh=close ll=close if movsrc1 then hh=high ll=low endif if ftype=1 then if hh>rngfilt[1] then if (hh-r)rngfilt[1] then rngfilt=rngfilt[1] else rngfilt=ll+r endif else //ftype1 if hh>=rngfilt[1]+r then rngfilt=(rngfilt[1]) + (abs(hh - (rngfilt[1]))/r)*r elsif llrngfilt[1] then upward=1 downward=0 endif if rngfilt rngfilt) and (close > (close[1])) and (upward > 0) then br=5 bg=255 bb=155 //#05ff9b elsif (close > rngfilt) and (close 0) then br=0 bg=179 bb=107 //#00b36b elsif (close < rngfilt) and (close 0) then br=255 bg=5 bb=131 //#ff0583 elsif (close = (close[1])) and (downward > 0) then br=184 bg=0 bb=93 //#b8005d else br=204 bg=204 bb=204 endif drawcandle(open,high,low,close) coloured(br,bg,bb) bordercolor(0,0,0) //Band Fills drawtriangle(barindex[1],hiband[1],barindex,rngfilt,barindex[0],hiband[0]) coloured(0,179,107,85) drawtriangle(barindex[1],hiband[1],barindex[1],rngfilt[1],barindex[0],rngfilt[0]) coloured(0,179,107,85) drawtriangle(barindex[1],loband[1],barindex,rngfilt,barindex[0],loband[0]) coloured(184,0,93,85) drawtriangle(barindex[1],loband[1],barindex[1],rngfilt[1],barindex[0],rngfilt[0]) coloured(184,0,93,85) endif return rngfilt coloured(cr,cg,cb) style(line,3) as "Filter"

Bonjour Nicolas, Est il possible de convertir cet indicateur en screener ? J'essaie depuis plusieurs jours mais impossible. Merci de votre retour.