What is the Range Filter?
As the author of the original Range Filter describes it:
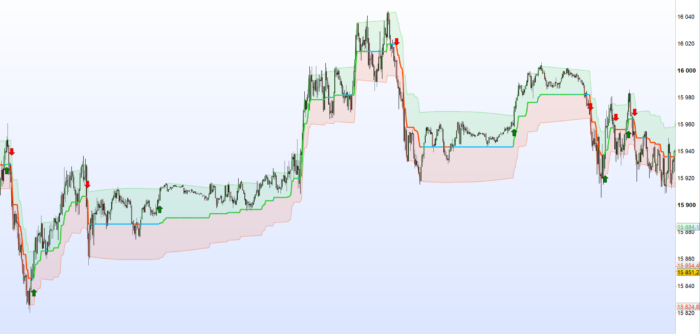
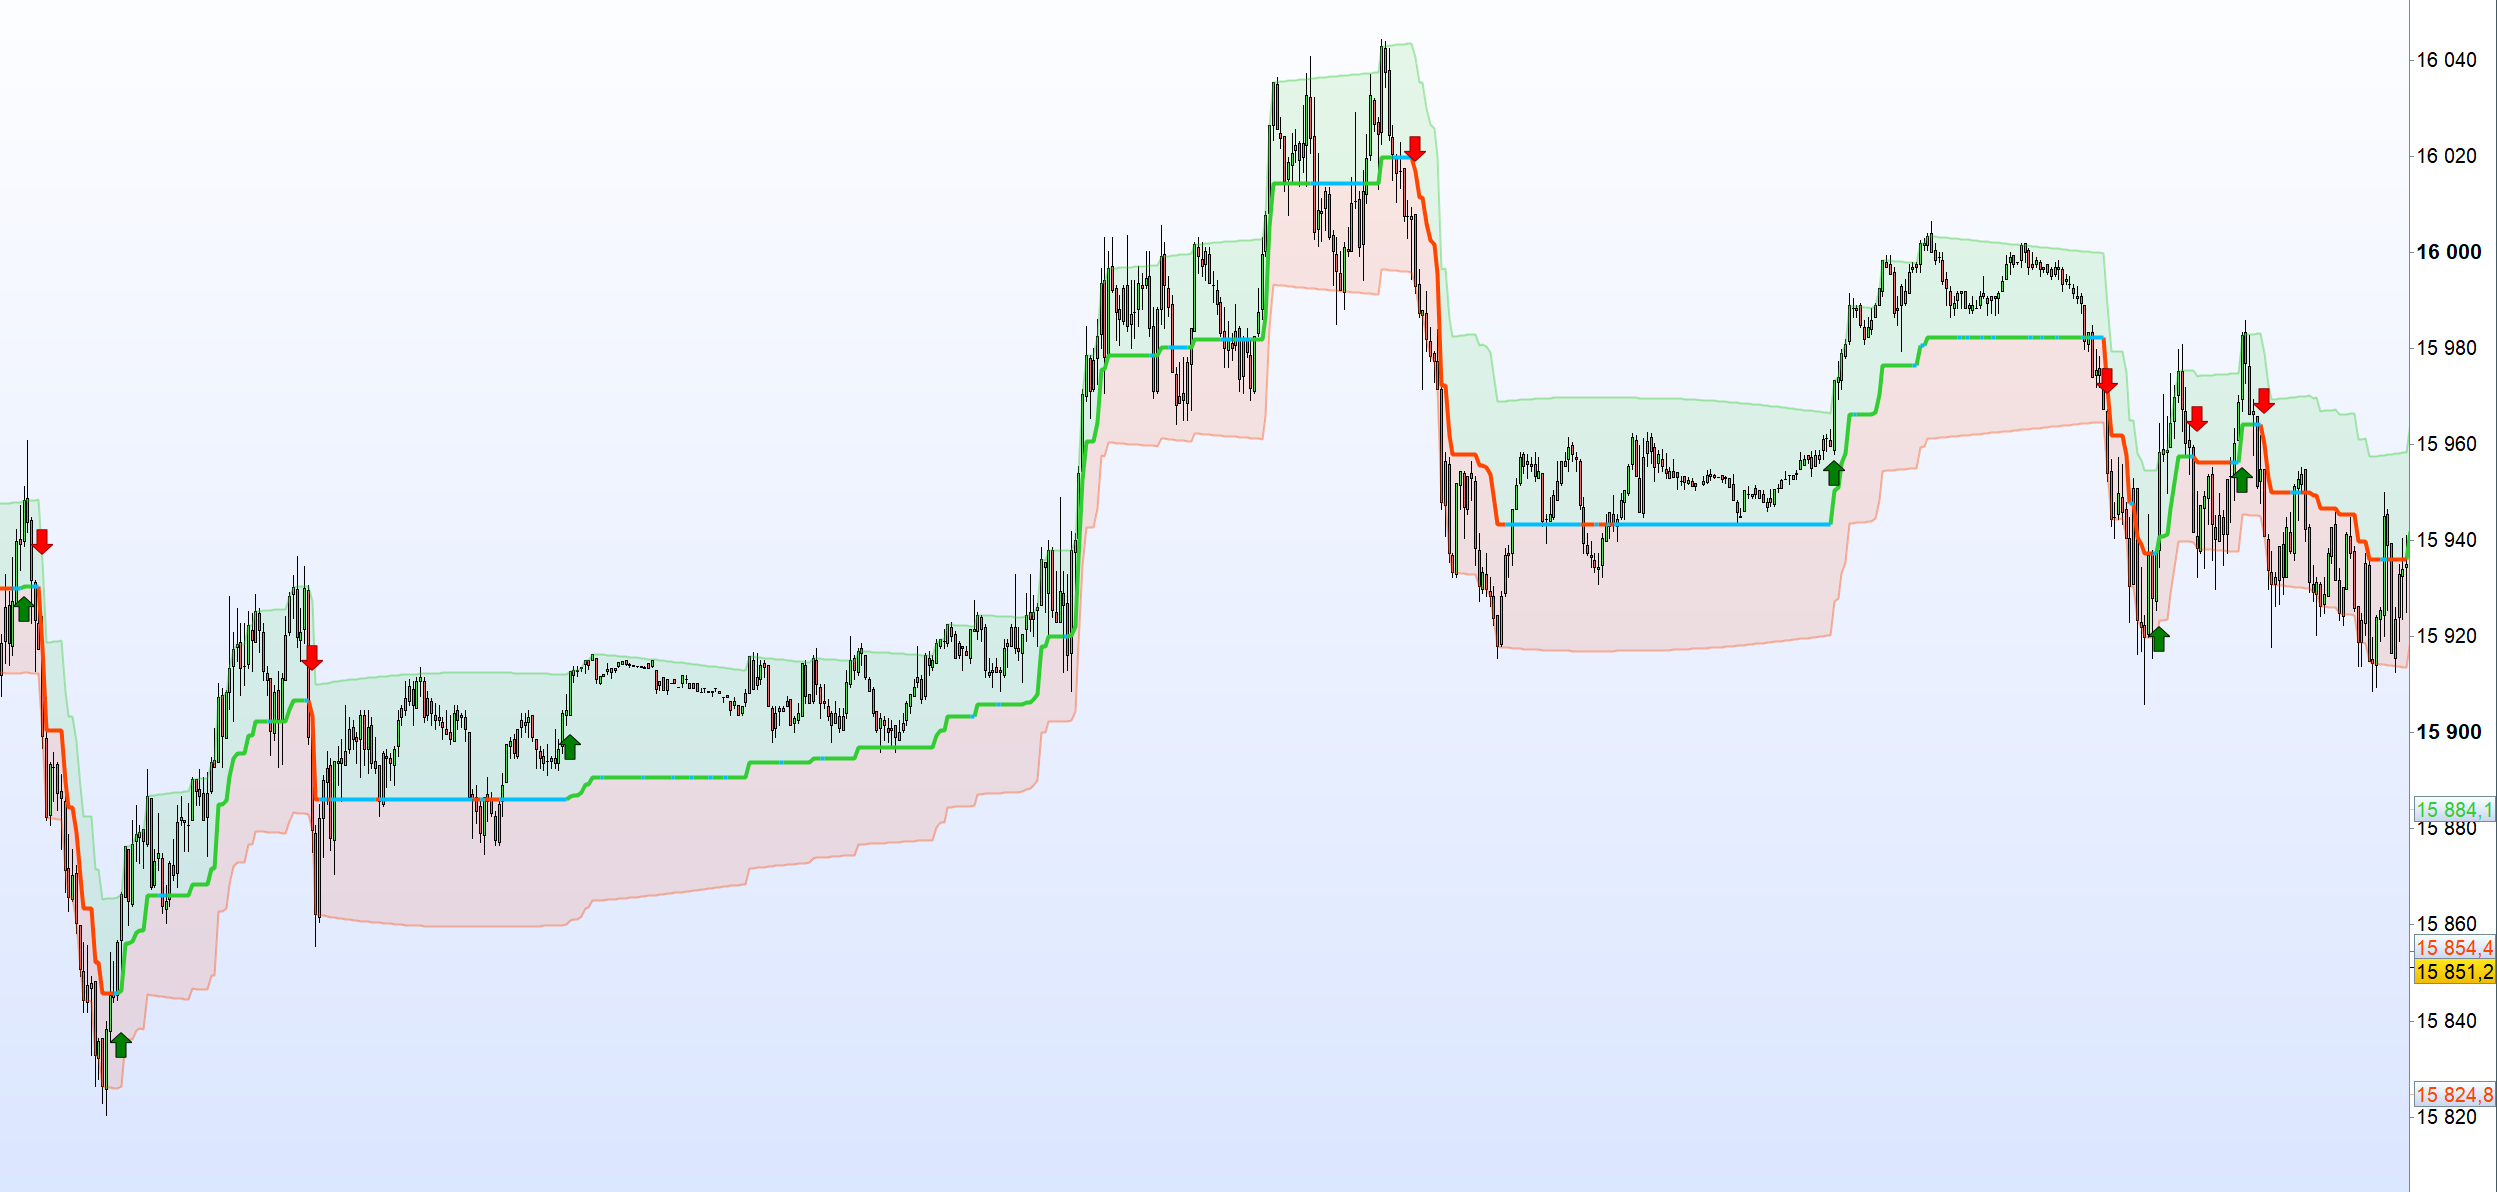
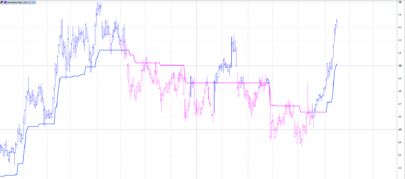
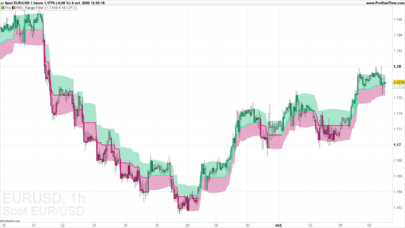
“This is an experimental study designed to filter out minor price action for a clearer view of trends. Inspired by the QQE’s volatility filter, this filter applies the process directly to price rather than to a smoothed RSI .
First, a smooth average price range is calculated for the basis of the filter and multiplied by a specified amount.
Next, the filter is calculated by gating price movements that do not exceed the specified range.
Lastly the target ranges are plotted to display the prices that will trigger filter movement.
Other different versions of the Range Filter code can be found here in the Library:
|
1 2 3 4 5 6 7 8 9 10 11 12 13 14 15 16 17 18 19 20 21 22 23 24 25 26 27 28 29 30 31 32 33 34 35 36 37 38 39 40 41 42 43 44 45 46 47 48 49 50 51 52 53 54 55 56 57 58 59 60 61 62 63 64 65 66 67 68 69 70 71 72 73 74 75 76 77 78 79 80 81 82 83 84 85 86 87 88 89 90 91 92 93 94 95 96 97 98 99 100 101 102 103 104 105 106 107 108 109 110 111 112 113 114 115 116 117 118 119 120 121 122 123 124 125 126 127 128 129 130 131 132 133 134 135 136 137 138 |
// Original Script > @DonovanWall // Adapted Version > @guikroth ////////////////////////////////////////////////////////////////////////// // Settings for 5min chart, BTCUSDC. For Other coin, change the parameters ////////////////////////////////////////////////////////////////////////// // Color variables downColorR = 255 downColorG = 69 downColorB = 0 upColorR = 50 upColorG = 205 upColorB = 50 midColorR = 0 midColorG = 191 midColorB = 255 // Source src = customclose // Sampling Period // Settings for 5min chart, BTCUSDC. For Other coin, change the paremeters // per = defval=100, minval=1, "Sampling Period" // Range Multiplier // mult = defval=3.0, minval=0.1, "Range Multiplier" // Smooth Average Range wper = per*2 -1 avrng = exponentialaverage[per](abs(src-src[1])) smrng = mult * exponentialaverage[wper](avrng) // Range Filter rngfilt = src If src > rngfilt[1] then If rngfilt[1] > src-smrng then rngfilt = rngfilt[1] Else rngfilt = src-smrng endif elsif rngfilt[1] < src+smrng then rngfilt = rngfilt[1] else rngfilt = src+smrng endif filt = rngfilt // Filter Direction upward = 0 If filt > filt[1] then upward = upward[1]+1 elsif filt < filt[1] then upward = 0 else upward = upward[1] endif downward = 0 If filt < filt[1] then downward = downward[1]+1 elsif filt > filt[1] then downward = 0 else downward = downward[1] endif // Target Bands hband = filt + smrng lband = filt - smrng // Colors If upward > 0 then filtcolorR = upColorR filtcolorG = upColorG filtcolorB = upColorB elsif downward > 0 then filtcolorR = downColorR filtcolorG = downColorG filtcolorB = downColorB else filtcolorR = midColorR filtcolorG = midColorG filtcolorB = midColorB endif if src > filt and src > src[1] and upward > 0 then barcolorR = upColorR barcolorG = upColorG barcolorB = upColorB elsif src > filt and src < src[1] and upward > 0 then barcolorR = upColorR barcolorG = upColorG barcolorB = upColorB elsif src < filt and src < src[1] and downward > 0 then barcolorR = downColorR barcolorG = downColorG barcolorB = downColorB elsif src < filt and src > src[1] and downward > 0 then barcolorR = downColorR barcolorG = downColorG barcolorB = downColorB else barcolorR = midColorR barcolorG = midColorG barcolorB = midColorB endif colorbetween(hband,filt,upColorR,upColorG,upColorB,30) colorbetween(lband,filt,downColorR,downColorG,downColorB,30) // Break Outs longCond = (src > filt and src > src[1] and upward > 0) or (src > filt and src < src[1] and upward > 0) shortCond = (src < filt and src < src[1] and downward > 0) or (src < filt and src > src[1] and downward > 0) CondIni = 0 If longCond then CondIni = 1 elsif shortCond then CondIni = -1 else CondIni = CondIni[1] endif longCondition = longCond and CondIni[1] = -1 shortCondition = shortCond and CondIni[1] = 1 //Alerts If longCondition then Drawarrowup(barindex,low-AverageTrueRange[14](close)) coloured("green",255) endif If shortCondition then Drawarrowdown(barindex,high+AverageTrueRange[14](close)) coloured("red",255) endif Return filt style(line,4) coloured(barcolorR,barcolorG,barcolorB,255) as "Range Filter", hband style(line,2) coloured(upColorR,upColorG,upColorB,100) as "High Target", lband style(line,2) coloured(downColorR,downColorG,downColorB,100) as "Low Target" |
Share this
No information on this site is investment advice or a solicitation to buy or sell any financial instrument. Past performance is not indicative of future results. Trading may expose you to risk of loss greater than your deposits and is only suitable for experienced investors who have sufficient financial means to bear such risk.
ProRealTime ITF files and other attachments :PRC is also on YouTube, subscribe to our channel for exclusive content and tutorials





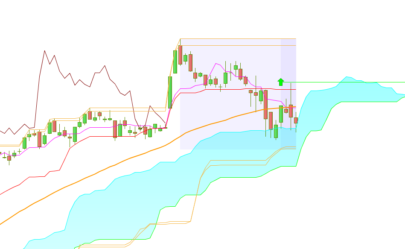


Bonjour, une petite demande concernant cet indicateur : comment faire pour que lorsque la bougie entre dans une zone verte ou rouge, cette zone change de couleur par exemple en rouge foncé ou en bleu (à la place du vert initial) ?
merci.
Bonne journée.
Bonjour, la coloration des bandes se fait ligne 111 et 112 à l’aide des instructions colorbetween. Il suffit de mettre ces deux instructions entre des conditions (IF THEN ELSE END) en fonction de ce que l’on veut exactement et de changer les couleurs appliquée en fonction des conditions, sachant que la ligne du milieu est filt, le haut hband, le bas lband. Tu peux ne changer que la transparence en fonctions des conditions désirée (ici elle st à 30). Voir : https://www.prorealcode.com/documentation/colorbetween/