Oscillator based on two moving averages: The first is a weighted moving average and the second one a simple average that detect the sensitivity of the movement of the price.
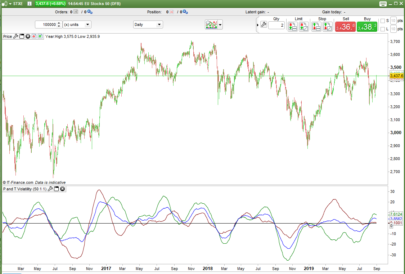
The indicator marks “dynamic supports” when MA crossing, making a channel in the price.
BUY conditions:
- When the SR (green) line is crossed up with the SR-Signal line (red line) it is called a continuation signal, a BUY signal is given.
- When the SR line (green) is outside the channel and crosses upwards with the Lower Limit (blue line) and this line with the SR-Signal line, a strong buy signal is given.
SELL conditions:
- When the SR (green) line crosses down with the SR-Signal line (red line) it is called a bearish cross, a sell signal is given.
- When the SR (green) line is outside the channel and crosses down with the Upper Limit (blue line) and this line with the SR-Signal line, a strong sell signal is given.
This indicator is accurate in 1 hour timeframe or higher timeframes and is adaptable as a separate indicator or next to the price.
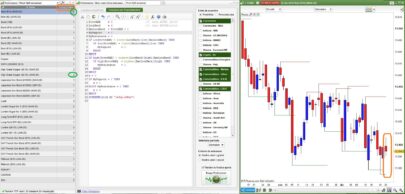
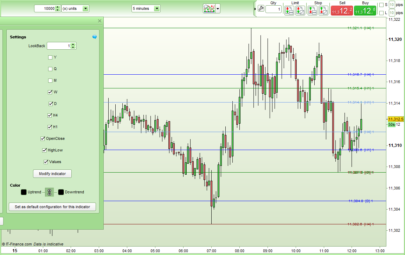
Attached channel configuration add a color zone and select Upper channel and Lower channel as shown in the picture.
|
1 2 3 4 5 6 7 8 9 10 11 12 13 14 15 16 17 18 19 20 21 22 23 24 25 26 27 28 29 30 |
//RB-SR | indicator //22.12.2017 //RB @ www.tiburonesdealetacorta.com //Sharing ProRealTime SRL=weightedaverage[8](close) SRR = average[8](close) SR = 2*srl - srr SRSL=weightedaverage[20](close) SRSR = average[20](close) srsignal = 2*srSl - srSr if sr>srsignal THEN UP = highest[round(150)](sr) NUP = highest[round(20)](srsignal) ELSE UP = highest[round(150)](srsignal) NUP = highest[round(20)](sr) ENDIF if sr<srsignal THEN Lowl = lowest[round(150)](sr) NIN = lowest[round(20)](srsignal) ELSE Lowl = lowest[round(150)](sr) NIN = lowest[round(20)](srsignal) ENDIF RETURN sr COLOURED(0,255,0) as "SR", srsignal COLOURED(255,0,0) as "SR-Signal", up COLOURED(51,51,255) as "Upper limit",lowl COLOURED(51,51,255) as "Lower limit",nup COLOURED(51,51,255) as "Neuronal Upper",nin COLOURED(51,51,255) as "Neuronal Lower" |
Share this
No information on this site is investment advice or a solicitation to buy or sell any financial instrument. Past performance is not indicative of future results. Trading may expose you to risk of loss greater than your deposits and is only suitable for experienced investors who have sufficient financial means to bear such risk.
ProRealTime ITF files and other attachments :PRC is also on YouTube, subscribe to our channel for exclusive content and tutorials
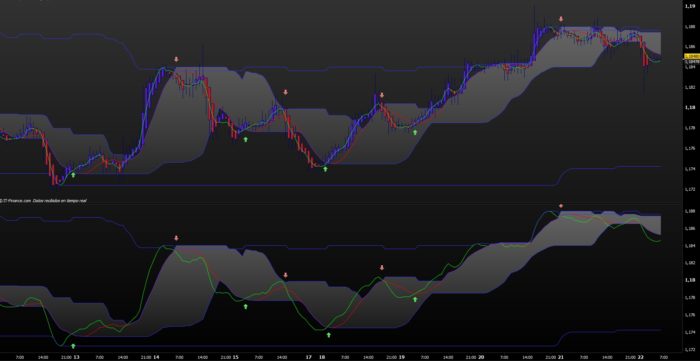

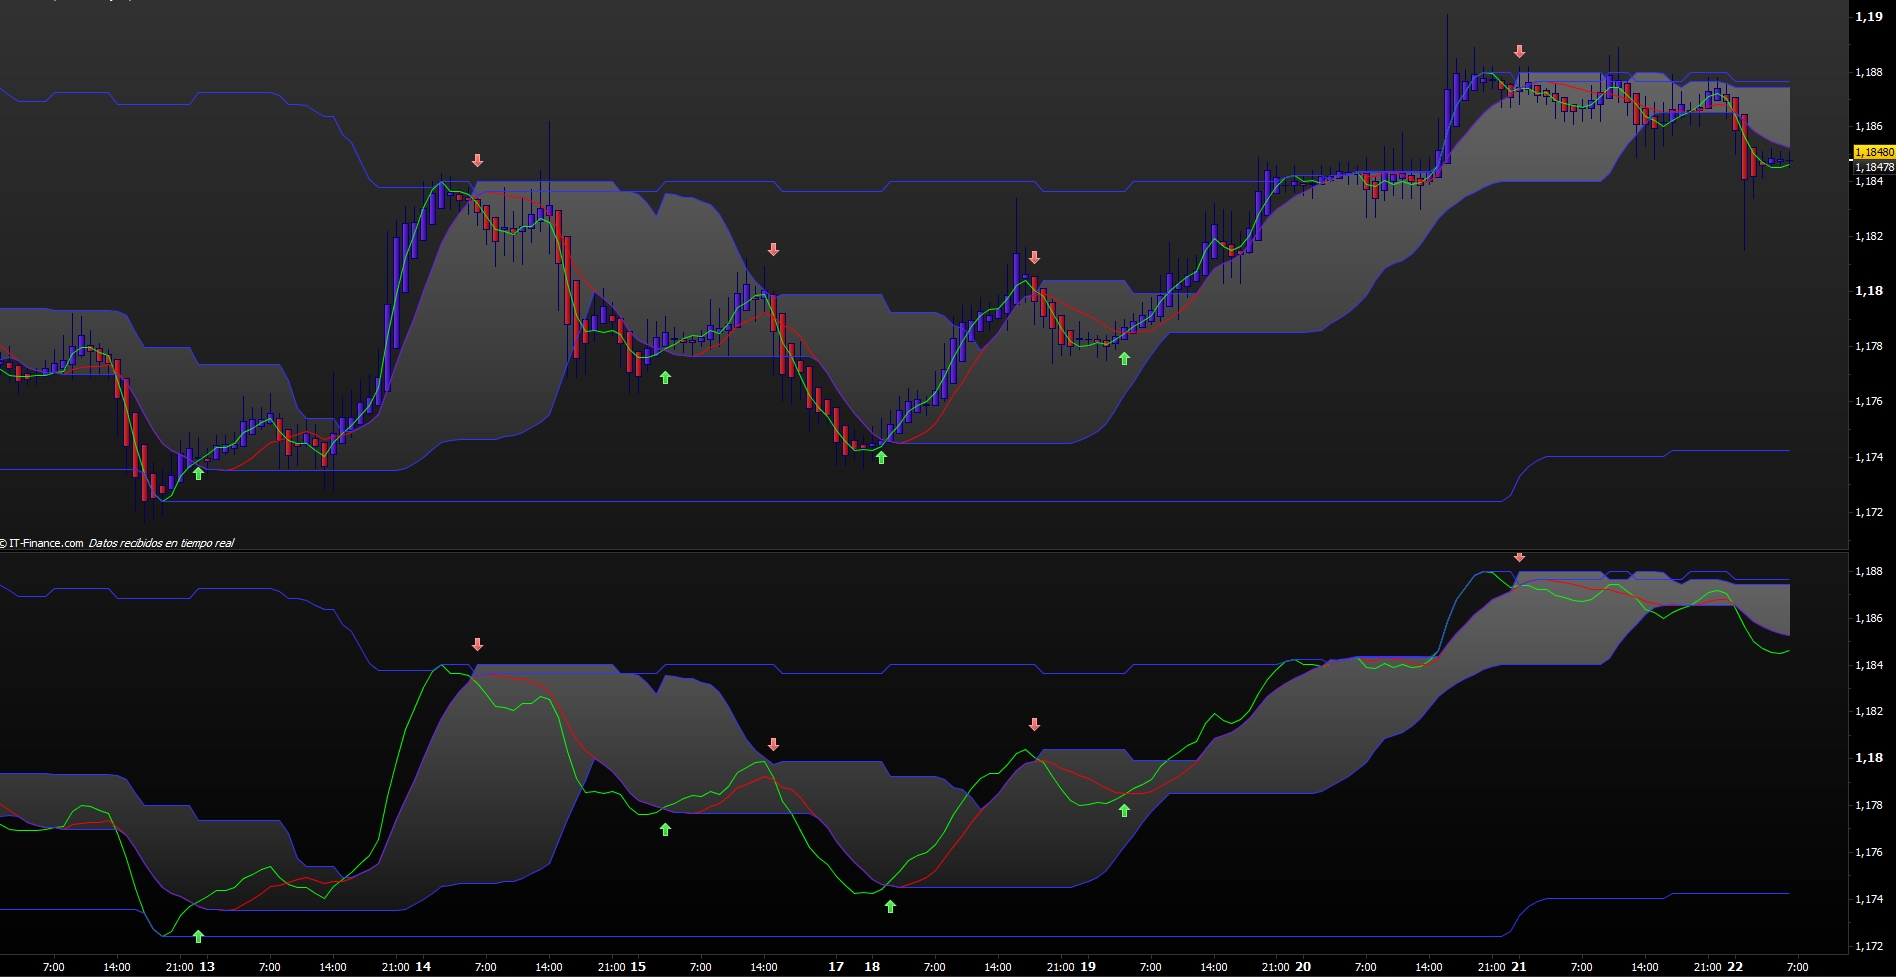





Podemos añadir este codigo para tener las flechas :
///////////////////////////////////////////////////////
If SRL crosses over SRR then
DRAWARROWUP ( barindex , low[1] )coloured (21,235,19,200)
endif
If SRL crosses under SRR then
DRAWARROWDOWN ( barindex , high[1] )coloured (234,20,170,200)
endif
///////////////////////////////////////////////////////
Thank you Supertiti for your contribution
best wishes
Buenas tardes y gracias por este magnifico indicador. Queria saber si tienes un proscreener de este indicador .
Que busque los valores que la linea verde acaba de cruzar al alza o a la baja
Tenéis algún screener de este indicador?