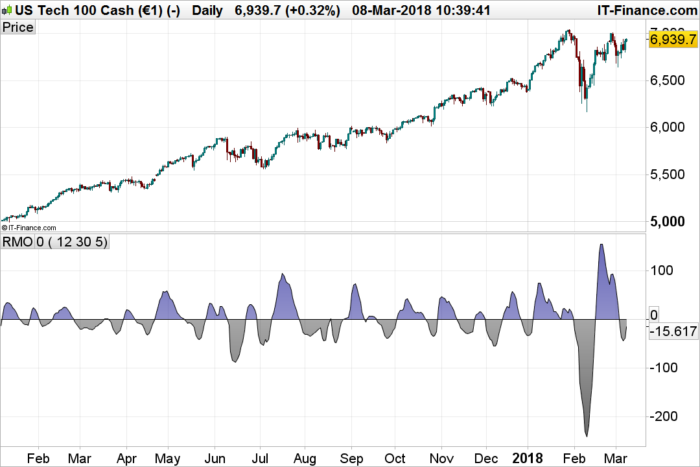
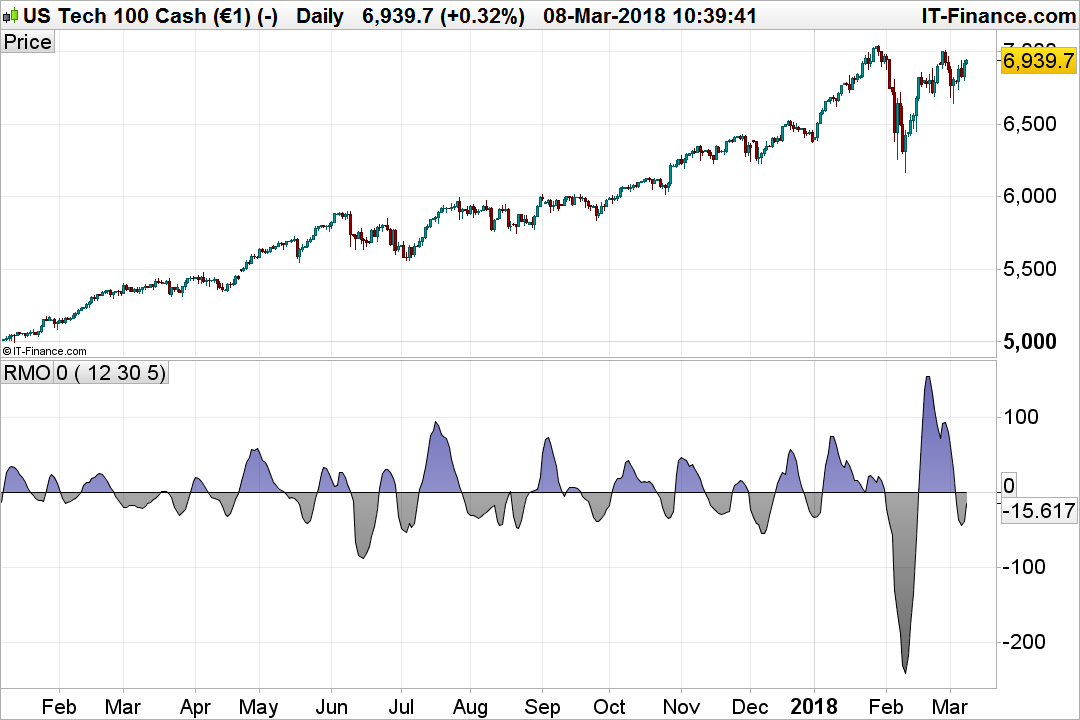
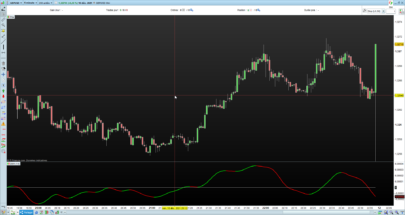
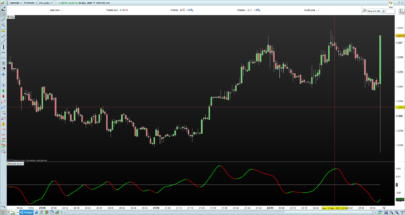
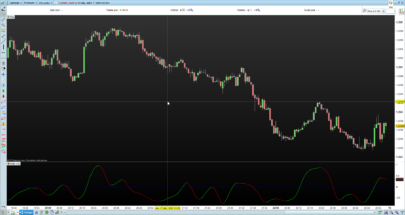
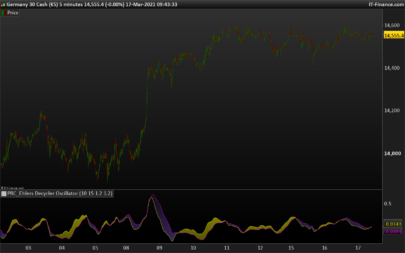
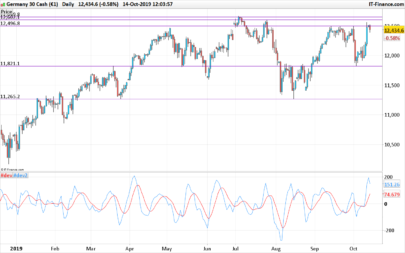
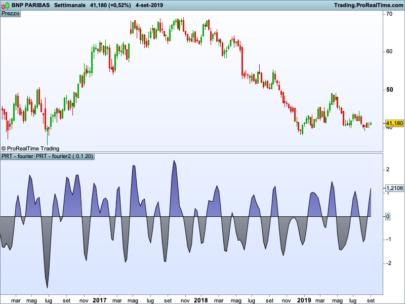
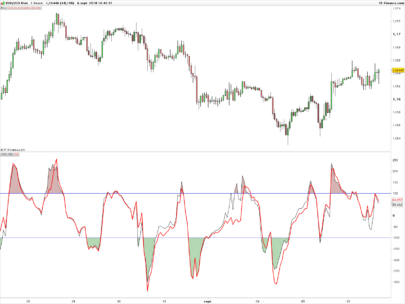
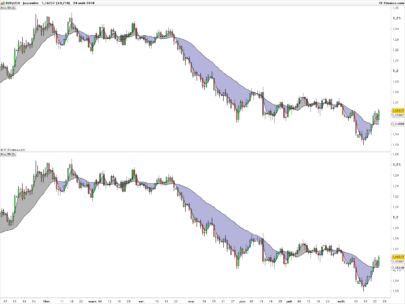
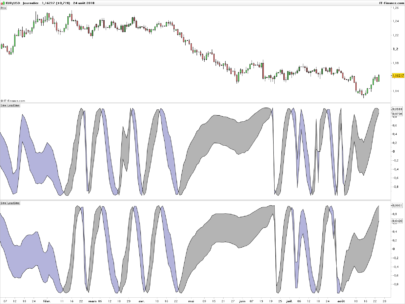
This is the the recursive median Oscillator featured by John Ehlers in the march 2017 issue of Trader’s Tips.
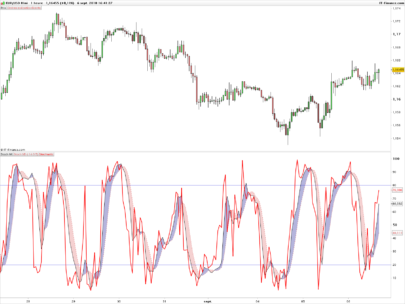
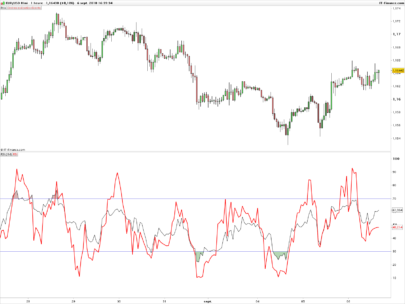
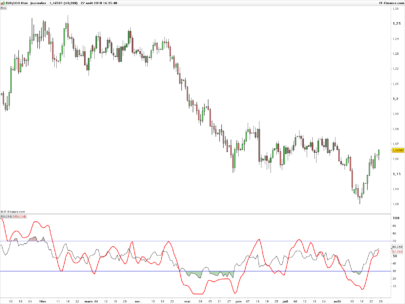
In “Recursive Median Filters” in this issue, author John Ehlers presents an approach for filtering out extreme price and volume data that can throw off typical averaging calculations. Ehlers goes on to present a novel oscillator using this technique, comparing its response to the well-known RSI. He notes that by being able to smooth the data with the least amount of lag, the recursive median oscillator may give the trader a better view of the bigger picture.
|
1 2 3 4 5 6 7 8 9 10 11 12 13 14 15 16 17 18 19 20 21 22 23 24 25 26 27 28 29 30 31 32 33 34 35 36 37 38 39 40 41 42 |
LPPeriod=12 HPPeriod=30 length=5 once Median=0 if barindex>length then // Set EMA constant from LPPeriod input Alpha1 = ( Cos( 360 / LPPeriod )+ Sin( 360 / LPPeriod ) - 1 )/ Cos( 360 / LPPeriod ) // get the median of the last length (default=5) closes FOR X = 0 TO length-1 M = close[X] //this example takes the median of the last 5 closes SmallPart = 0 LargePart = 0 FOR Y = 0 TO length-1 IF close[Y] < M THEN SmallPart = SmallPart + 1 ELSIF close[Y] > M THEN LargePart = LargePart + 1 ENDIF IF LargePart = SmallPart AND Y = length-1 THEN Median = M BREAK ENDIF NEXT NEXT // Recursive Median (EMA of a 5 // bar Median filter) RM = Alpha1 * Median + ( 1 - Alpha1 ) * RM[1] // Highpass filter cyclic components // whose periods are shorter than // HPPeriod to make an oscillator Alpha2 = ( Cos( .707 * 360 / HPPeriod ) + Sin( .707 * 360 / HPPeriod ) - 1 ) / Cos( .707 * 360 / HPPeriod ) RMO = ( 1 - Alpha2 / 2 ) * ( 1 - Alpha2 / 2 ) * ( RM - 2 * RM[1] + RM[2] ) + 2 * ( 1 - Alpha2 ) * RMO[1] - ( 1 - Alpha2 ) * ( 1 - Alpha2 ) * RMO[2] endif return RMO as "RMO", 0 as "0" |
Share this
No information on this site is investment advice or a solicitation to buy or sell any financial instrument. Past performance is not indicative of future results. Trading may expose you to risk of loss greater than your deposits and is only suitable for experienced investors who have sufficient financial means to bear such risk.
ProRealTime ITF files and other attachments :PRC is also on YouTube, subscribe to our channel for exclusive content and tutorials



Thanks, Despair. Wasn’t it the most recent issue though, i.e. March 2018?
You are right, it is from March 2018. 🙂
See this PRT link for more details from Stocks & Commodities Magazine:
https://www.prorealcode.com/topic/ehlers-mesa-indicators-constantly-reload-recalculate/#post-65420
(submit link button wouldn’t open)
From the url link #post-65420 above but without the chart image:
Stocks & Commodities V. 36:03 (8–11): Recursive Median Filters by John F. Ehlers
Impulsive noise spikes or extreme price or volume data are not unusual in the nancial markets and these extreme values can throw off your averaging calculations. How can you set up a data lter to re- move these extreme price movements? This STOCKS & COMMODITIES Contributing Editor shows you a way to handle this by using a lter that discards all data except the median value.
Median lters are best applied to remove impulsive or spiking types of noise. Rather than averaging the spike into the lter out- put, median lters simply ignore the spike. Median lters are routinely used for pro-
cessing photographs and video because they preserve the sharp edges in the images rather than smoothing them as is done by averaging lters. Median lters have the unique characteristic of being idempotent, that is, if you repeatedly perform median ltering on a time waveform, the output rapidly converges to being exactly the input waveform except for com- putational lag. That a price waveform converges to a core waveform has some interesting philosophical rami cations for trading.
HOW SO?
Median lters are nonlinear. Since a median lter is not a convolution lter, it cannot be suitably represented in the Fourier frequency domain. Also, its output is not differentiable and therefore does not have a Taylor series expansion. This precludes curve- tting by a higher-order polynomial.
There are many academic articles describing rather arcane algorithms for recursive median lters. The rea- son I consider the algorithms arcane is they exclusively study nite impulse response (FIR) types of lters.
This is because the applications being considered are being implemented in hardware rather than software. “Recursive” means using a previous calculation in the current calculation.
APPLYING IT
An example of a recursive lter used in trading is the exponential moving average (EMA). I propose a recur- sive median lter for trading be implemented as the EMA of a ve-bar median lter. A simple pseudocode representation of a recursive median lter is:
Output = a*Median(Input, 5) + (1 – a)*Output[1];
The EMA a is a constant between zero and 1. I prefer to calculate it in terms of the critical period of the lter. The critical period is where shorter wavelengths are passed by the lter and longer wavelengths are rejected at the lter output. The relationship between the EMA constant and critical period is expressed by the equation:
a = (Cosine (360 / Period) + Sine (360 / Period) – 1) / Cosine (360 / Period)
where the arguments of the trigonometric terms are in degrees.
An easier-to-remember approximation to the re- lationship between the EMA constant and critical period is:
a = 5 / Period
MORE FILTERING
An interesting and unique oscillator-type indicator can be cre- ated from the recursive median lter by further ltering with a second-order highpass lter. The highpass lter removes the DC (constant) values and very long wavelength components from the recursive median lter output. Using a second-order lter guarantees attenuation of the long wavelength components resulting from the statistical fractal pink-noise spectral shape of market data.
The second-order nature of the highpass lter reduces its critical period about 70% relative to the critical period of an EMA lter. The EasyLanguage code to compute the recursive median oscillator is given in sidebar “EasyLanguage Code For Recursive Median Oscillator.”
You can see the uniqueness and novelty of the recursive median oscillator when you compare it to the RSI (Figure 1). The recursive median oscillator is displayed in the rst sub- graph and the RSI is plotted in the second subgraph. The RSI is scaled to swing from -1 to +1 instead of the standard swing from zero to 100. The price data for Figure 1 is of the SPY for
the calendar year 2017. The recursive median oscillator uses a 40-bar (two-month) critical highpass period and the RSI uses a standard 14-bar calculation. Both indicators have a smoothing lter critical period of 16 bars. From Figure 1 you can see that the recursive median oscillator has less lag and generally has faster response to the larger moves in the price data.
SMOOTH AND EFFICIENT
When data contains impulsive noise or uctuations in data, a trader needs to gure out how to smooth that data with the least amount of lag. The recursive median oscillator meets this need by ltering out outlier data, which gives a better view of the bigger picture.
S&C Contributing Editor John Ehlers is a pioneer in the use of cycles and DSP technical analysis. He is president of MESA Software and cofounder of StockSpotter.com. MESASoftware. com offers the MESA Phasor and MESA intraday futures strategies.
The code given in this article is available in the Article Code section of our website, http://www.Traders.com.
(See our Traders’ Tips section beginning on page 48 for commentary and implementation of John Ehlers’ technique in various technical analysis programs. Accompanying program code can be found in the Traders’ Tips area at Traders.com.
The EasyLanguage code to compute the recursive median Filter is given in sidebar “EasyLanguage Code For Recursive Median Filter.”)
Note: lter = filter
Apologies, there’s been an issue with copying “f” and “I” from the article and pasting.. which in part, is why I’m waiting for UPS to take this new MacBook Pro back to today…