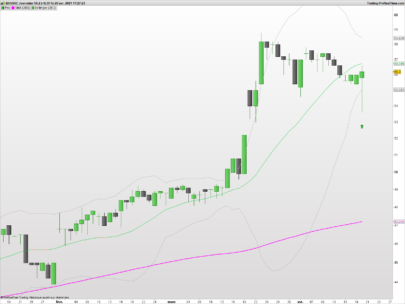
REGRESION & STATISTICAL BANDS
Ver. 1.00.a by @Xel_Arjona
Intro:
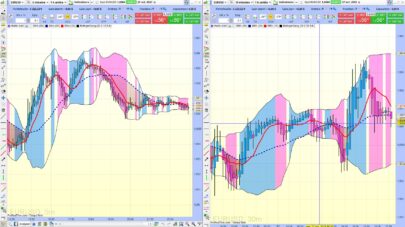
This is an approach to get in one single indicator one of the best of both mathematical worlds:
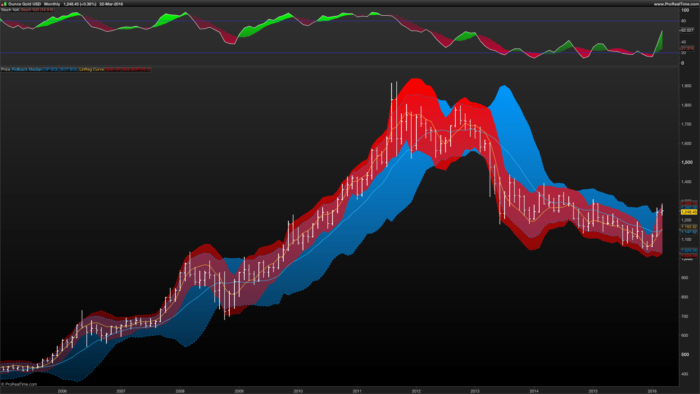
From within the STATISTICAL side, everybody well konwn the wide use of the STANDARD DEVIATION with a Multiplier Factor from within a Rolling Back MEDIAN (Simple Moving Average) best known as the famous and widly used “Bollinger Band“.
From within the REGRESSION ANALYSIS side, the relevant importance of the STANDARD ERROR (of the estimate) with a Multiplier Factor from within an Ordinary Least Squares Curve generated from the last rolling back sample of the series. For this purpose, a well documented indicator alone was already posted.
Both indicators are in sync from a unique Rolling Back Period window. From this perspective, the Regression Analysis tend to “catch” faster moves and volatility while the Statistical band is perfect for mid to long term move confirmation.
The Code:
P = 21, MF = 2
|
1 2 3 4 5 6 7 8 9 10 11 12 13 14 15 16 17 18 19 20 21 22 23 |
// REGRESSION & STATISTICAL BANDS AR = close N = barindex LR = linearregression[P](AR) M = Average[P](AR) // STANDARD ERROR OF THE ESTIMATE bv1 = summation[P](N*AR) - (P*Average[P](N)*Average[P](AR)) bv2 = summation[P](square(N)) - (P*square(Average[P](N))) CalcB = bv1/bv2 CalcA = Average[P](AR) - (CalcB*Average[P](N)) sev1 = Summation[P](square(AR)) - (CalcA*Summation[P](AR)) - (CalcB*Summation[P](N*AR)) sev2 = P - 2 SEE = sqrt(sev1/sev2) // BANDS SeUB = LR + (SEE*MF) SeBB = LR - (SEE*MF) BoUB = M + (STD[P](AR)*MF) BoBB = M - (STD[P](AR)*MF) // OUTPUT RETURN M AS "Rollback Median", BoUB AS "UP BOL", BoBB AS "BOT BOL", LR AS "LinReg Curve", SeUB AS "SEB UP", SeBB AS "SEB BOT" |
Cheers.
Share this
No information on this site is investment advice or a solicitation to buy or sell any financial instrument. Past performance is not indicative of future results. Trading may expose you to risk of loss greater than your deposits and is only suitable for experienced investors who have sufficient financial means to bear such risk.
ProRealTime ITF files and other attachments :PRC is also on YouTube, subscribe to our channel for exclusive content and tutorials
