INDICATOR
– Relative Bias Filter
– Version 1.01
– Maz @ prorealcode.com
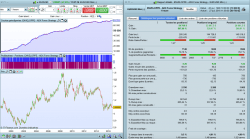
I have developed this indicator primarily as a tool for algorithmic trading. This version has been formatted for easy graphical representation. It can also work as an aid on the chart.
Relative Bias Filter is used as a tool to prevent taking low probability trades. Please do come forward if you find this useful and/or wish to discuss further.
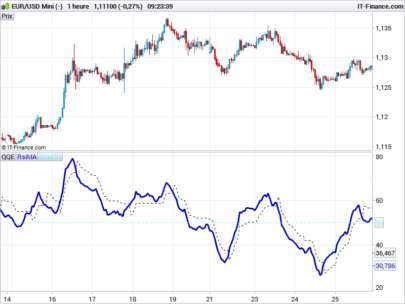
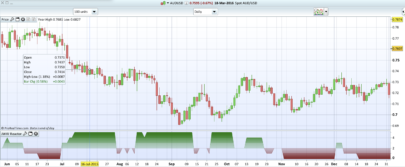
Outputs
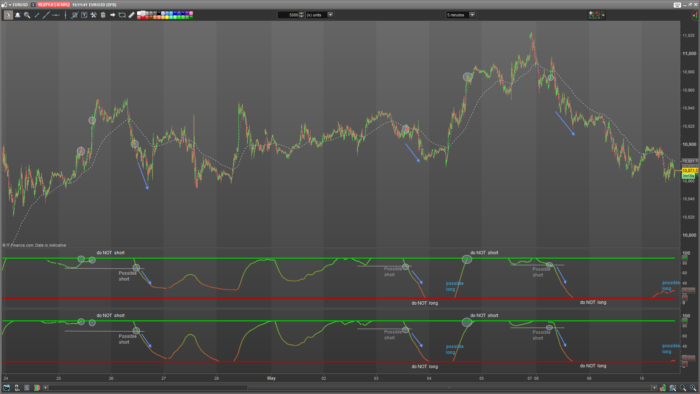
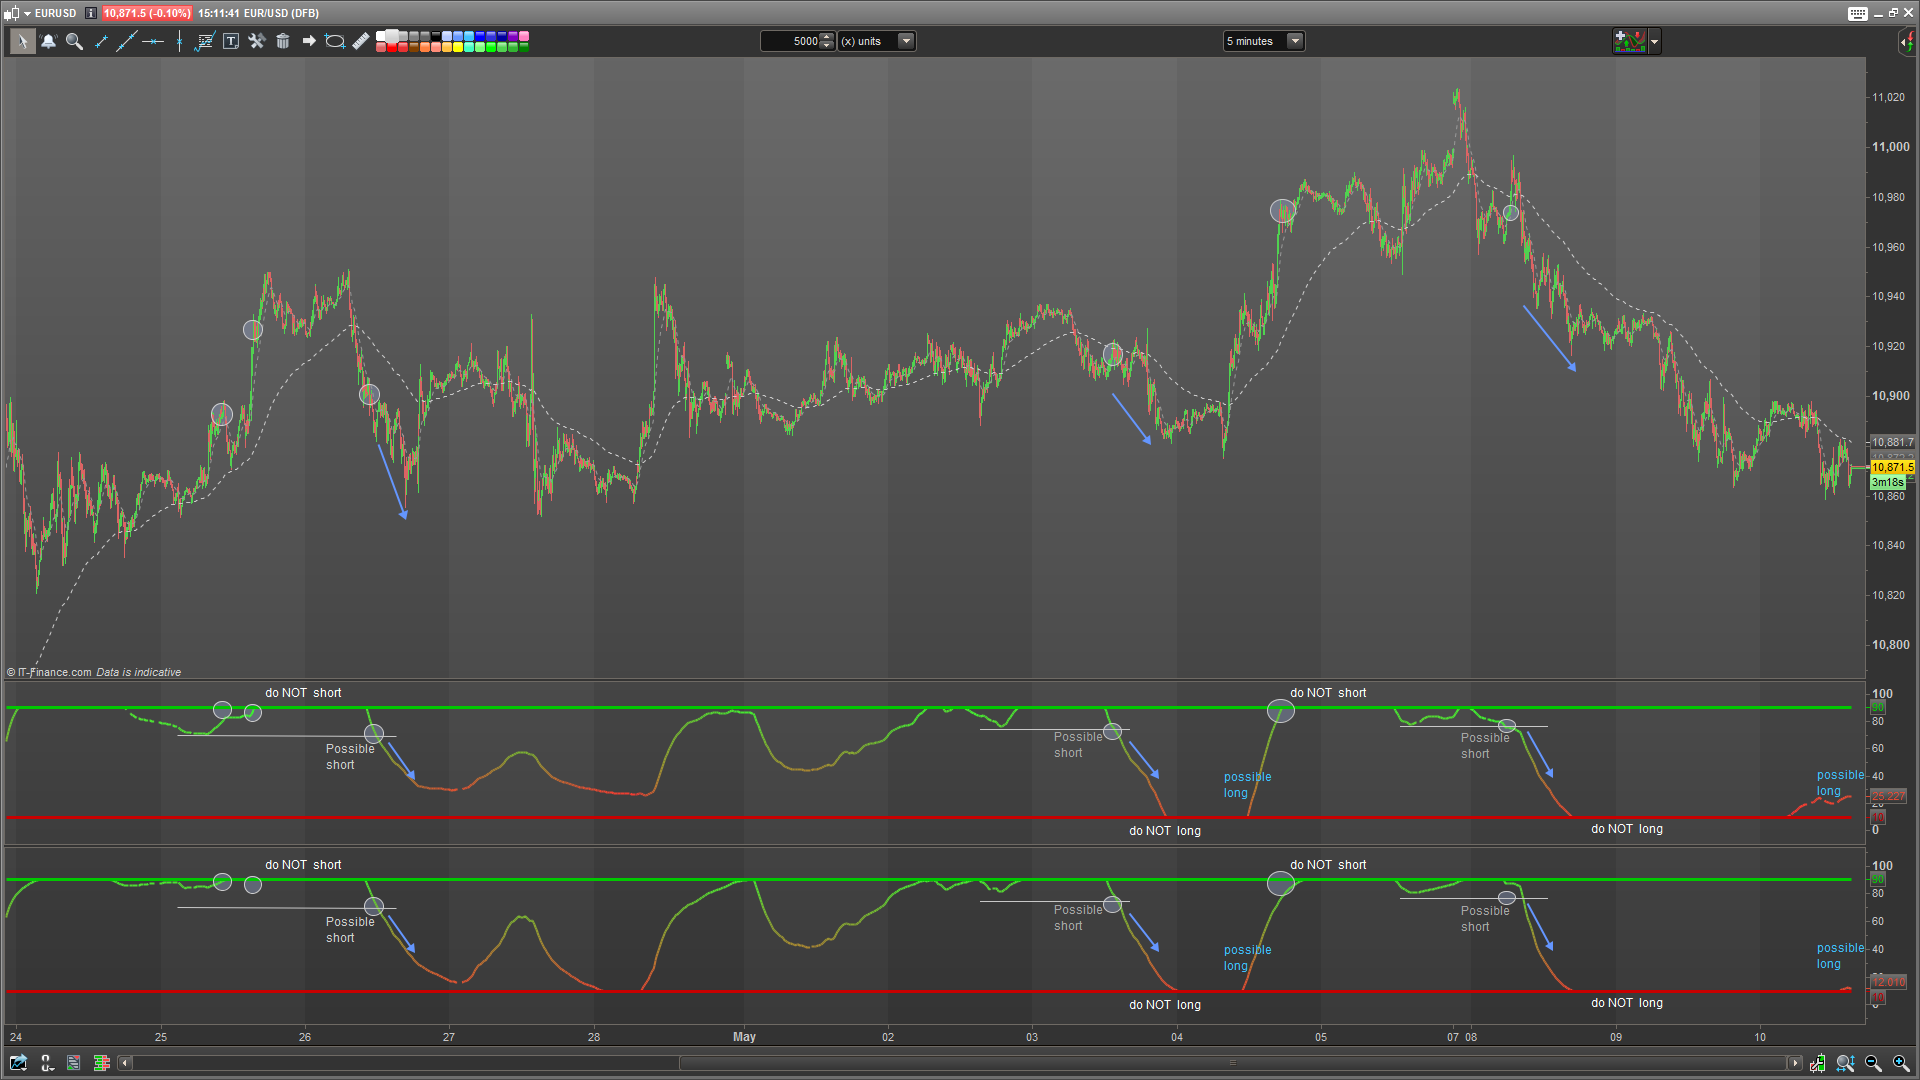
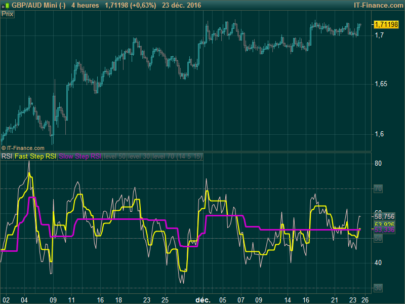
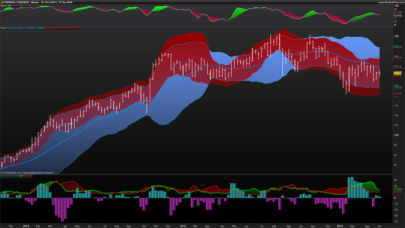
– Top line threshold beyond which no shorts should be taken
– Bottom line threshold beyond which no longs should be taken
– Signal line – to be interpreted as a soft switch or recommendation
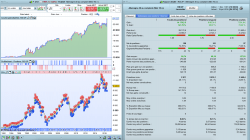
INTERPRETATION
There are multiple ways to interpret this indicator but its primary function is to help you avoid low probability positions. Here are some scenarios:
– Signal line moving up into the STRONG (top) line represents bull trend strength and recommends against going short. Longs that are already running have a good chance.
– Signal line moving down into the the WEAK (bottom) line represents bear trend strength and the recommendation is against taking longs. Shorts that are aleady running have a good chance.
– LONG setups may arrise when the bias filter line pops up above the WEAK bottom line. Long setup is weaker if the bias filter curves off. Any such setups should be validated with other indicators
– SHORT setups may arrise when the bias filter line pops down below the STRONG top line. Short setup is weaker if the bias filter line curves off. Any such setups should be validated with other indicators
SETTINGS
Response: (Typical range – 25 to 100)
This adjusts the responsiveness of the signal line. Lower values are less lagging and more noisy. Higher values are less noisy but more lagging. Optimizations should take place on your intended instrument.
Cutoff: (Typical range – 1 to 20)
This adjusts bandwidth between the top (strong) and bottom (weak) lines. The higher the number the more sensitive the “Do not long” / “Do not short” switch becomes.
MODES
Reletive Bias Filter runs in 4 modes:
– Simple
– Dynamic
– Complex
– Complex Dynamic
Each combination of modes will have a considerable affect on overall output.
Dynamic mode:
In Dynamic mode the indicator will adjust an internal look-back period relative to the response rate setting (double the response setting). Without Dynamic switched on, the internal look-back is always set to 200 bars. This is used
Complex mode:
In Complex mode we introduce ADX weighting to our signal switch. If the ADX is strong and rising, we accelerate our signal line and thus we switch bias more quickly. If the ADX is weak and falling then our signal line is attenuated and thus we reach our extremes less quickly. Using Complex mode helps to validate price action strength and weakness. You will receive more setups with complex mode – but also more noise. I won’t go into the technical explanation of how complex mode is calculated but feel free to get in touch if you have any suggestions.
|
1 2 3 4 5 6 7 8 9 10 11 12 13 14 15 16 17 18 19 20 21 22 23 24 25 26 27 28 29 30 31 32 33 34 35 36 37 38 |
// INDICATOR // Relative Bias Filter // Version 1.01 // Maz @ prorealcode.com // Variables // response = 100 // cutoff = 10 // dynamicMode = 0 // true | false // complexMode = 0 // true | false once cutoff = min(45, max(1, cutoff)) once response = max(2, response) once btm = 0 + cutoff once top = 100 - cutoff if dynamicMode then period = response*2 //200 else period = 200 endif ar = rsi[response](average[period](TypicalPrice)) if complexMode then adxA = adx[period] adxB = adxr[period] // divide by 50 for sronger weigheting or /100 for softer weighting adxRsiOffset = (rsi[round(period/2)](adxA+adxB/2))/50 x = ((ar-50)*adxRsiOffset)+50 x = (x + ar) / 2 // optional parallel re-mixing of original signal resultLine = min(top, max(btm, x)) else resultLine = min(top, max(btm, ar)) endif // Colour management (PRT 10.3+) r = 50+(100-ar)*2 g = 50+ar*2 return resultLine coloured(r, g, 50) style(dottedline, 2) as "Bias Filter", btm coloured(200, 0, 0) style(line, 3) as "weak", top coloured(0, 200, 0) style(line, 3) as "strong" |
Share this
No information on this site is investment advice or a solicitation to buy or sell any financial instrument. Past performance is not indicative of future results. Trading may expose you to risk of loss greater than your deposits and is only suitable for experienced investors who have sufficient financial means to bear such risk.
ProRealTime ITF files and other attachments :
Find other exclusive trading pro-tools on ![]()
PRC is also on YouTube, subscribe to our channel for exclusive content and tutorials


how can I code the slope of the result line? So that I can take long trades when the line is going from bottom to top and short when it’s going down.
Thanks for this MAZ:-)
I will also try and implement it in manual trading.
I changed the variables to fit a 15 min TF
Seems valid
// response = 50
// cutoff = 10
// dynamicMode = 1 // true | false
// complexMode = 1 // true | false
Thanks! excellent
Thanks Maz.
Thanks for the job. Which variables do you suggest for timeframe 1 hour?
This a great momentum filter! I would like to see volume momentum incorporated into the indicator. The idea would consist of reduced price momentum and increase in volume momentum for supply and demand zone setups. Any ideas?
Depends massively on your market and the volatility. I suggest using the variable optimizer by writing a simple buy/sell trading system. Otherwise just play around until it until you can discover a reliable pattern.