1. Introduction
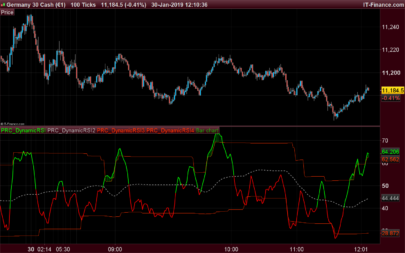
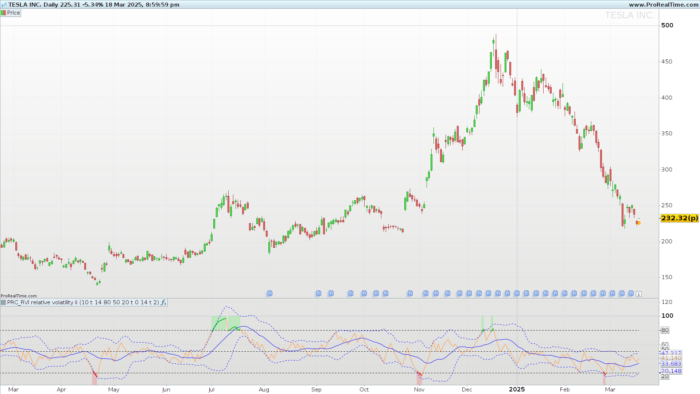
The Relative Volatility Index (RVI) is a technical indicator designed to measure the direction and magnitude of volatility. Unlike other volatility indicators that focus solely on the level of price fluctuations (such as Bollinger Bands or ATR), the RVI incorporates the trend direction, making it a valuable tool for identifying potential trade opportunities.
Developed in 1993 by Donald Dorsey, the RVI is often used in combination with trend-following indicators to confirm signals. It resembles the Relative Strength Index (RSI) but instead of measuring price momentum, it focuses on volatility direction.
2. Calculating the RVI
The RVI is calculated based on the standard deviation of price changes, smoothed over a predefined period. Here’s the step-by-step process:
-
Standard Deviation Calculation:
- The indicator computes the standard deviation (σ) of price over a selected period.
- The standard deviation can be calculated using either the population or sample method.
-
Directional Volatility Components:
- If the closing price of the current bar is higher than the previous close, the volatility is considered positive.
- If the closing price is lower, the volatility is negative.
-
Smoothing the RVI:
- The RVI is obtained by smoothing the ratio of positive volatility to total volatility over a set period.
The formula for the RVI is:
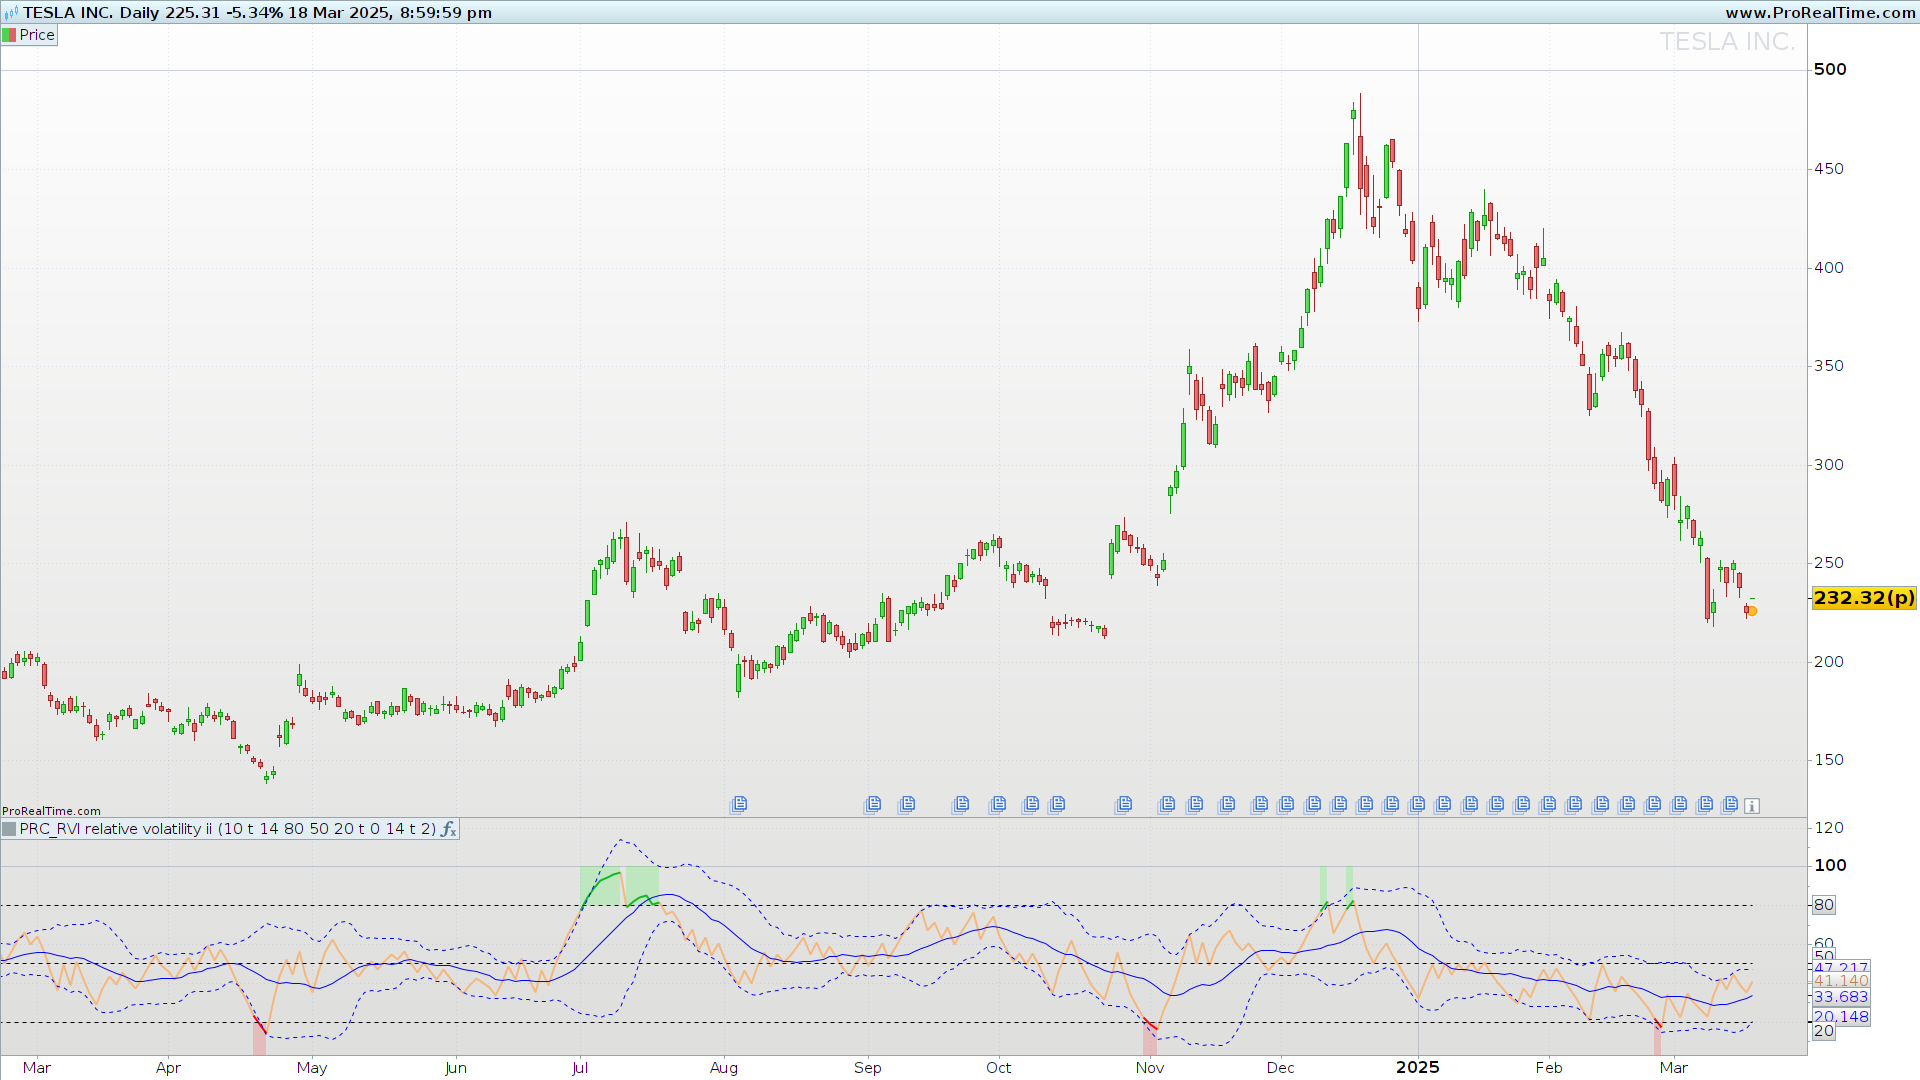
Values range from 0 to 100, where higher values indicate stronger upward volatility, and lower values signal downward volatility.
3. Configuration and Parameters
The RVI can be customized using several key parameters:
- Standard Deviation Length (stdevLength): Defines the period for the standard deviation calculation (default: 10).
- Smoothing Length (smoothLength): Defines the period used to smooth the RVI calculation (default: 14).
- Overbought Level (obLevel): A predefined level where volatility suggests an overbought market (default: 80).
- Oversold Level (osLevel): A predefined level where volatility suggests an oversold market (default: 20).
- Moving Average Length (maLengthInput): Optional smoothing with a moving average (default: 14).
- Bollinger Bands Activation (useBB): Allows the addition of Bollinger Bands around the RVI.
4. Interpretation and Trading Strategies
How to Use the RVI in Trading?
The RVI is commonly used to confirm trend strength and identify potential reversals:
-
Trend Confirmation:
- A rising RVI suggests increasing bullish volatility, confirming an uptrend.
- A falling RVI suggests increasing bearish volatility, confirming a downtrend.
-
Overbought/Oversold Signals:
- If the RVI crosses above 80, it may indicate an overbought condition.
- If the RVI drops below 20, it may signal an oversold condition.
-
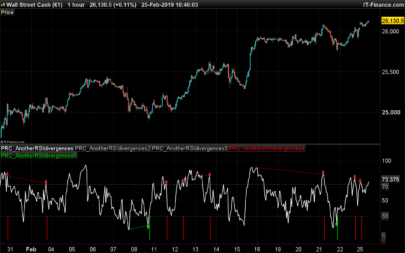
Divergences:
- If price makes a new high, but the RVI fails to do so, a bearish divergence may indicate weakening momentum.
- If price makes a new low, but the RVI remains stable or rises, a bullish divergence may signal a potential reversal.
Strategy Ideas Using the RVI
-
RVI + Moving Average:
- Use a moving average of the RVI to filter out noise.
- Buy when the RVI crosses above its moving average.
- Sell when the RVI crosses below its moving average.
-
RVI + Bollinger Bands:
- If the RVI moves outside the upper Bollinger Band, it signals extreme bullish volatility.
- If the RVI moves outside the lower Bollinger Band, it signals extreme bearish volatility.
-
Breakout Confirmation:
- Highlight breakouts by coloring the area where the RVI crosses key levels.
- If RVI crosses above 80 and price breaks resistance, it confirms strong bullish momentum.
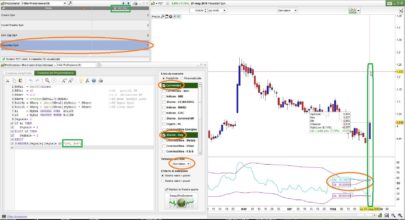
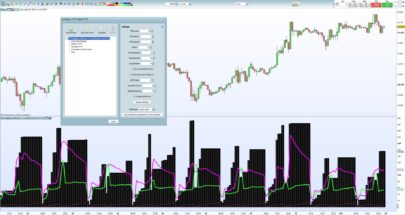
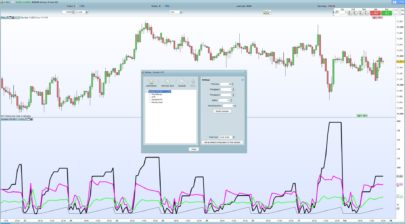
5. Implementation in ProRealTime
The RVI can be programmed in ProRealTime’s ProBuilder language, ensuring flexibility in customization. The implementation follows these key steps:
- Compute the standard deviation using the selected calculation method.
- Determine directional volatility (upward or downward).
- Apply smoothing to refine the final RVI value.
- Optionally, add a moving average and Bollinger Bands for additional analysis.
- Visualize the indicator with color-coded levels to highlight overbought and oversold zones.
The ProBuilder code follows these principles and allows easy parameter adjustments.
|
1 2 3 4 5 6 7 8 9 10 11 12 13 14 15 16 17 18 19 20 21 22 23 24 25 26 27 28 29 30 31 32 33 34 35 36 37 38 39 40 41 42 43 44 45 46 47 48 49 50 51 52 53 54 55 56 57 58 59 60 61 62 63 64 65 66 67 68 69 70 71 72 73 74 75 76 77 78 79 80 81 82 83 84 85 86 |
//------------------------------------------------------// //PRC_RVI relative volatility Index //version = 0 //06.02.2025 //Iván González @ www.prorealcode.com //Sharing ProRealTime knowledge //------------------------------------------------------// // Inputs //------------------------------------------------------// stdevLength=10 stdevType=1 //boolean variable 1 means Population smoothLength=14 obLevel=80 mdLevel=50 osLevel=20 highlightBreakouts=1 //boolean variable maTypeInput=0 maLengthInput=14 useBB=1 bbMultInput=2 src=close //------------------------------------------------------// // Standard deviation calculation //------------------------------------------------------// //Type=1 Population else Sample if stdevType=1 then selectedStdev=STD[stdevLength](src) else dev=src-average[stdevLength](src) variance=summation[stdevLength](pow(dev,2))/(stdevLength-1) selectedStdev=sqrt(variance) endif //------------------------------------------------------// // RVI original version (1993) //------------------------------------------------------// up=(src>=src[1])*selectedStdev down=(src<src[1])*selectedStdev upsum=average[smoothLength,1](up) downsum=average[smoothLength,1](down) rvi=100*upsum/(upsum+downsum) //------------------------------------------------------// // Moving average //------------------------------------------------------// maRVI=average[maLengthInput,maTypeInput](rvi) if useBB then bbUpperband=maRVI+std[maLengthInput](rvi)*bbMultInput bbLowerband=maRVI-std[maLengthInput](rvi)*bbMultInput endif //------------------------------------------------------// // Plot //------------------------------------------------------// //---Rvi color if rvi>oblevel then r=14 g=187 b=35 elsif rvi<oslevel then r=255 g=0 b=0 else r=244 g=183 b=125 endif //---HighlightBreakouts if rvi>oblevel and highlightBreakouts then rob=0 gob=255 alphaob=40 else alphaob=0 endif if rvi<oslevel and highlightBreakouts then ros=255 gos=0 alphaos=40 else alphaos=0 endif colorbetween(100,oblevel,rob,gob,0,alphaob) colorbetween(0,oslevel,ros,gos,0,alphaos) //------------------------------------------------------// return rvi as "RVI" coloured(r,g,b)style(line,2),maRVI as "MA RVI"coloured("blue"), oblevel as "Overbought Level"coloured("black")style(dottedline),oslevel as "Oversold Level"coloured("black")style(dottedline),mdLevel as "MidLevel" coloured("black")style(dottedline),bbUpperband as "BBUp"coloured("blue")style(dottedline),bbLowerband as "BBDn"coloured("blue")style(dottedline) |
6. Conclusion
The Relative Volatility Index (RVI) is a powerful tool that provides insight into the direction of volatility, helping traders confirm trends and identify reversals. While it should not be used in isolation, combining it with moving averages, Bollinger Bands, or other momentum indicators can enhance its effectiveness.
Share this
No information on this site is investment advice or a solicitation to buy or sell any financial instrument. Past performance is not indicative of future results. Trading may expose you to risk of loss greater than your deposits and is only suitable for experienced investors who have sufficient financial means to bear such risk.
ProRealTime ITF files and other attachments :
Find other exclusive trading pro-tools on ![]()
PRC is also on YouTube, subscribe to our channel for exclusive content and tutorials