Introduction
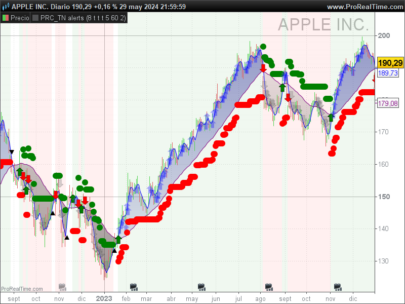
Today, I want to talk to you about a breakout indicator that can be useful when capturing new trends. This is the “Reversal & Breakout Signals” indicator.
Indicator Description
The “Reversal & Breakout Signals” indicator uses a combination of moving averages and volume analysis to predict reversal points and breakouts in the market.
The basis of the indicator includes:
1.- Hull Moving Average (HMA): A moving average that helps to reduce lag and increase sensitivity to price changes.
2.- Weighted Averages of Highs and Lows: Used to establish the upper and lower channel levels, offering a clear view of potential breakout points.
3.- Volume Conditions: Volume is analyzed to confirm the strength behind breakout movements, using a specific threshold that indicates strong volume.
Main Applications
This indicator can be very useful for traders looking to capture large market movements right at their onset. Some of the applications include:
1.- Identification of Breakouts: Clear signals when the price crosses the established channel levels, indicating a possible entry.
2.- Detection of Reversals: The indicator is capable of signaling rejections at critical price levels, suggesting entry opportunities against the current trend.
Indicator Settings
The parameters of the “Reversal & Breakout Signals” indicator can be adjusted to suit different trading styles and assets.
The main parameters include:
len (Indicator Length): Determines the number of bars used to calculate the averages and channels.
vlen (Volume Strength Period): Defines the period over which the volume average is calculated to compare with the current volume.
threshold (Strong Volume Threshold): Sets the level needed to consider that the volume is significantly high.
ProRealTime Indicator Code
The code for the indicator in ProRealTime is as follows:
|
1 2 3 4 5 6 7 8 9 10 11 12 13 14 15 16 17 18 19 20 21 22 23 24 25 26 27 28 29 30 31 32 33 34 35 36 37 38 39 40 41 42 43 44 45 46 47 48 49 50 51 52 53 54 55 56 57 58 59 60 61 62 63 64 65 66 67 68 69 70 71 72 73 74 75 76 77 78 79 80 81 82 83 84 85 86 87 88 89 90 91 92 93 94 95 96 97 |
//----------------------------------------------------------------------// //PRC_Reversal&Breakout Signals //version = 0 //11.04.24 //Iván González @ www.prorealcode.com //Sharing ProRealTime knowledge //----------------------------------------------------------------------// //-----Inputs-----------------------------------------------------------// len=20//Indicator period vlen=20//Volume Strength period threshold=1.5//Stong Volume Threshold trnd=1//Colour Candles During Trends //----------------------------------------------------------------------// //-----Hull moving average----------------------------------------------// hma=hullaverage[30](close) //----------------------------------------------------------------------// //-----Volume conditions------------------------------------------------// rvol=volume/average[vlen](volume) strongvol=rvol>threshold //----------------------------------------------------------------------// //-----Weighted moving average------------------------------------------// sh=weightedaverage[len](high) sl=weightedaverage[len](low) //----------------------------------------------------------------------// //-----Channel----------------------------------------------------------// ch=highest[len](sh) cl=lowest[len](sl) //----------------------------------------------------------------------// //-----High and Low Levels definition-----------------------------------// if not (ch<ch[1] or ch>ch[1]) then hstore=ch[1] elsif not (cl<cl[1] or cl>cl[1]) then lstore=cl[1] endif midline=(hstore+lstore)/2 //----------------------------------------------------------------------// //-----Candle direction-------------------------------------------------// if close > open then candledir = 1 else candledir = -1 endif //----------------------------------------------------------------------// //-----Breaks and Reversals Definition---------------------------------// breakout=candledir and close>hstore and open<hstore breakdown=candledir=-1 and close<lstore and open>lstore //-----Bullish BreakOut bullishbreakout= (breakout or ((breakout[1] or breakout[2] or breakout[3] or breakout[4]) and candledir = 1)) and strongvol and not (bullishbreakout[1] or bullishbreakout[2] or bullishbreakout[3]) //-----Bearish BreakOut bearishbreakout = (breakdown or ((breakdown[1] or breakdown[2] or breakdown[3] or breakdown[4]) and candledir = -1)) and strongvol and not (bearishbreakout[1] or bearishbreakout[2] or bearishbreakout[3]) //-----Bullish Reversal bullishrej = (low < lstore and close > lstore) and not (bullishrej[1] or bullishrej[2] or bullishrej[3] or bullishrej[4]) //-----Bearish Reversal bearishrej = (high > hstore and close < hstore) and not (bearishrej[1] or bearishrej[2] or bearishrej[3] or bearishrej[4]) //-----Trend Status if bullishbreakout then state=1 elsif bearishbreakout then state=-1 elsif (low crosses over lstore and state=-1) or (high crosses under hstore and state=1) then state=0 endif //------------------------------------------------------------------------// //-----Plot Trend Tracker and color Candles-------------------------------// if state=-1 then TrendTracker=hma drawpoint(barindex,TrendTracker,1)coloured("red") if trnd then DRAWCANDLE(open, high, low, close)coloured("red") endif elsif state=1 then TrendTracker=hma drawpoint(barindex,TrendTracker,1)coloured("green") if trnd then DRAWCANDLE(open, high, low, close)coloured("green") endif else TrendTracker=0 endif //------------------------------------------------------------------------// //-----Show Bullish and Bearish Reversals---------------------------------// if bullishrej and not (state=-1) then drawtext("▲",barindex,low-0.25*tr)coloured("green") elsif bearishrej and not (state=1) then drawtext("▼",barindex,high+0.25*tr)coloured("red") endif //------------------------------------------------------------------------// //-----Show Bullish and Bearish Breakouts---------------------------------// if bullishbreakout then drawtext("♦",barindex,low-0.25*tr)coloured("yellow") DRAWCANDLE(open, high, low, close)coloured("yellow") elsif bearishbreakout then drawtext("♦",barindex,high+0.25*tr)coloured("yellow") DRAWCANDLE(open, high, low, close)coloured("yellow") endif //----------------------------------------------------------------------// return hstore as "Upper Level" coloured("red",50)style(line,2), lstore as "Lower Level" coloured("green",50)style(line,2), midline as "Midline"coloured("grey",50) |
Conclusion
The “Reversal & Breakout Signals” indicator is an essential tool for those who wish to enhance their ability to detect entry and exit points with great precision. Experimenting with this indicator in different markets and conditions can provide traders with a significant competitive advantage in their operations.
Share this
No information on this site is investment advice or a solicitation to buy or sell any financial instrument. Past performance is not indicative of future results. Trading may expose you to risk of loss greater than your deposits and is only suitable for experienced investors who have sufficient financial means to bear such risk.
ProRealTime ITF files and other attachments :PRC is also on YouTube, subscribe to our channel for exclusive content and tutorials


Ciao Ivan
si puo’ inserire una strategia su questo indicatore
per ottimizzare le variabili e creare un trading system?
Grazie