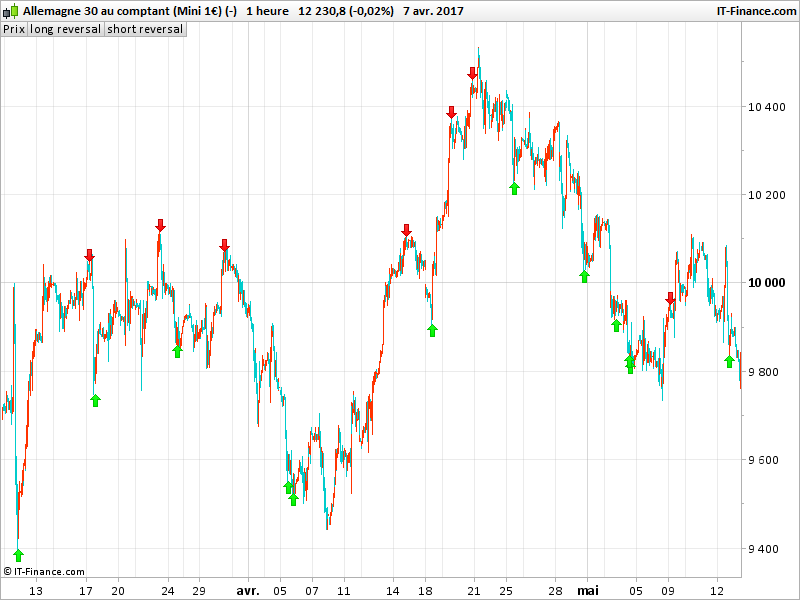
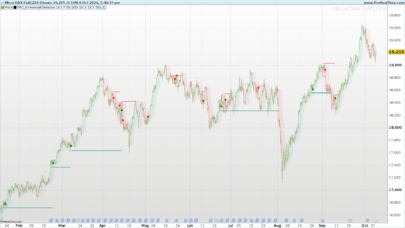
This indicator finds and displays the potential bullish and bearish turning points using different parameters:
LONG SIGNALS
1. Red/Green candle (reversal)
2. Bullish candle close above the open of the previous red candle
3. Space to the left (the low of the last 3 candles lower than the low of the last 50 candles)
4. default stochastic (8,3,3) was in the oversold area within the last 3 candles
SHORT SIGNALS
1. Green/Red candle (reversal)
2. Bearish candle close below the close of the previous green candle
3. Space to the left (the high of the last 3 candles higher than the high of the last 50 candles)
4. default stochastic (8,3,3) was in the overbought area within the last 3 candles
Indicator coded by a request in the English forum.
|
1 2 3 4 5 6 7 8 9 10 11 12 13 14 15 16 17 18 19 20 21 22 23 24 25 26 27 28 29 30 31 32 33 34 35 36 37 38 39 40 41 |
//PRC_Reversal point indicator | indicator //09.04.2017 //Nicolas @ www.prorealcode.com //Sharing ProRealTime knowledge //https://www.prorealcode.com/topic/need-help-coding-the-following-reversal-indicator/ // LONG //Red/Green candle (reversal) //Bullish candle close above the open of the previous red candle //Space to the left (the low of the last 3 candles lower than the low of the last 50 candles) //default stochastic (8,3,3) was in the oversold area within the last 3 candles sto = stochastic[8,3] c1 = close[1]<open[1] and close>open c2 = close>open[1] c3 = lowest[3](low)<lowest[50](low)[1] or lowest[3](low)<lowest[50](low)[2] or lowest[3](low)<lowest[50](low)[3] c4 = summation[3](sto<20)>0 long = c1 and c2 and c3 and c4 if long then drawarrowup(barindex,lowest[3](low)) coloured(0,255,0) endif // SHORT //Green/Red candle (reversal) //Bearish candle close below the close of the previous green candle //Space to the left (the high of the last 3 candles higher than the high of the last 50 candles) //default stochastic (8,3,3) was in the overbought area within the last 3 candles. c5 = close[1]>open[1] and close<open c6 = close<open[1] c7 = highest[3](high)>highest[50](high)[1] or highest[3](high)>highest[50](high)[2] or highest[3](high)>highest[50](high)[3] c8 = summation[3](sto>80)>0 short = c5 and c6 and c7 and c8 if short then drawarrowdown(barindex,highest[3](high)) coloured(255,0,0) endif return long as "long reversal", short as "short reversal" |
Share this
No information on this site is investment advice or a solicitation to buy or sell any financial instrument. Past performance is not indicative of future results. Trading may expose you to risk of loss greater than your deposits and is only suitable for experienced investors who have sufficient financial means to bear such risk.
ProRealTime ITF files and other attachments :PRC is also on YouTube, subscribe to our channel for exclusive content and tutorials







Thank you, very interesting, work well on Italy 40 with 30m TF
Buonasera Nicolas, l’indicatore va inserito sul prezzo? ho provato ma il grafico mi viene schiacciato, non capisco perchè.
Grazie
Replace the last line with “RETURN” only.
Hi Nicolas, would it be possible to show the indicator as a series of 1 and -1 to be used as a external indicator, not one to be added on the chart, in order to make the backtest easier?
I actually sorted it out
golong = longgoshort = short*-1return golong as “LONG”,goshort as “SHORT”,0
Hey Francesco, this indicator is getting way too little praise – I find it extremely useful and effective. Would love to backtest it, but I can’t really figure out what exactly you changed in the code. Mind to enlighten me? Thanks!!
gracias , muy bueno
Bonjour, excusez mon français. Est-il possible de mettre les résultats des stratégies dans Excel? Comment vous pouvez combiner plusieurs stratégies pour l’ensemble des résultats?Merci a tous.
Hello, sorry for my English. Is there a way to put the results of the strategies in Excel? How can you combine several strategies to see overall results?Thank you
Please ask general purposes questions on forums. Thanks.
Bonsoir Nicolas,
Je vais sans doute poser une tien un peu bête, mais serait-il possible d’avoir ce code mais pour MT4, bien que ce soit un site pour PRT ?!
Si il s’agit d’une demande privée pourquoi pas, mais il faudrait passer par le service programmation: https://www.prorealcode.com/trading-programming-services/
i try that indicator Nicolas..give me some days for see how it work
Why does this Indicator reduce my price chart to a very narrow horizontal channel. Something simple I’m missing?
I’d add a screen shot but Library posts will not allow this.
Thank YouGraHal
In price settings, use auto scale of vertical axis to use price only.
No sé lo que hago mal . si en la ultima linea solo dejo “return” no funciona y si lo pongo tal qual me altera la escala. me ayudas nicolas? gracias
En la configuración de precios, use la escala automática del eje vertical para usar sólo el precio.
Hello can anyone help me turn this into mt4 code? Please. I don’t know anything about coding.
This website is dedicated to Prorealtime programming. However, you can ask for personalized codes at the programming services : https://www.prorealcode.com/trading-programming-services/
Hello Nicolas.
Good Work!
Where can i find a basic code to trade divergences?
There are many divergences indicators on the website already, please make a quick search with the website search engine. Thank you.
Buonasera sig. Nicolas. Complimenti per la sua competenza. Potrebbe darmi qualche suggerimento su alcuni codici che non riesco a far funzionare in piattaforma? Grazie.
This works well. But it works even better if you use the Ehler’s Mesa (Cycle) Period Finder! https://www.prorealcode.com/topic/ehlers-sinewave-indicator/
Here’s a screenshot of the difference between the standard indicator with default settings and an indicator that has Ehler’s Universal Oscillator replacing the standard Oscillator and uses Ehler’s MESA Period to determine the cycle period. The S&P500 period was found at 32 bars and I used an average of 25 bar cycles.
The modified indicator seems to take less false short signals while picking up a few more longs. My arrows are dark green and orange.
The only thing that isn’t working is the variable settings window control of the Oscillator bandedge values, that has to be set manually within the code and not from the settings window. Not sure why? If anyone had any ideas that’d be appreciated.
I’m not a coder so please let me know if it’s not coded correctly. Cheers.
https://www.dropbox.com/s/ardrak2xsg5ehrv/Reversalpointunivosc.png?dl=0
(Neither Firefox or Chrome is adding the code here).
//PRC_Reversal point indicator | indicator
//09.04.2017
//Nicolas @ http://www.prorealcode.com
//Sharing ProRealTime knowledge
//https://www.prorealcode.com/topic/need-help-coding-the-following-reversal-indicator/
//LowestLow = 50 — Use Mesa Period
//HighestHigh = 50
// DrawText
offset1 = 17 * pipsize //150 Dow
//offset2 = offset1 * 4 // Default = 4
//Bandedge = 25
UnivOsc = MyUnivOsc
MyUnivOsc, ignored = Call “Ehler’s Univ Osc SuperSmoother”[25]
// LONG
//Red/Green candle (reversal)
//Bullish candle close above the open of the previous red candle
//Space to the left (the low of the last 3 candles lower than the low of the last 50 candles)
//default stochastic (8,3,3) was in the oversold area within the last 3 candles
c1 = close[1]open
c2 = close>open[1] //default >
c3 = lowest[3](low)<lowest[LowestLow](low)[1] or lowest[3](low)<lowest[LowestLow](low)[2] or lowest[3](low)<lowest[LowestLow](low)[3]
c4 = summation[3](UnivOsc0
long = c1 and c2 and c3 and c4
if long then
drawarrowup(barindex,lowest[3](low)-offset1) coloured(51,102,0) //=dark green //default (0,255,0)
endif
// SHORT
//Green/Red candle (reversal)
//Bearish candle close below the close of the previous green candle
//Space to the left (the high of the last 3 candles higher than the high of the last 50 candles)
//default stochastic (8,3,3) was in the overbought area within the last 3 candles.
c5 = close[1]>open[1] and close<open
c6 = close<open[1] //default highest[HighestHigh](high)[1] or highest[3](high)>highest[HighestHigh](high)[2] or highest[3](high)>highest[HighestHigh](high)[3]
c8 = summation[3](UnivOsc>0.9)>0
short = c5 and c6 and c7 and c8
if short then
drawarrowdown(barindex,highest[3](high)+offset1) coloured(255,153,0) //=orange //default (255,0,0)
endif
return long as “Long Reversal”, short as “Short Reversal”
Can anyone figure out how to automate it using assisted creation? I tried this — pls see image:
https://www.dropbox.com/s/4lw5j7miwv2sm4f/reversalassitedcreation.png?dl=0
but it won’t take trades at the position of the arrows. (Takes no trades). Cheers!
Arrows are plotted in the past afterwards.
Thanks Nicolas, does it repaint like the Belkhayate indicator?
Sorry I replied too fast. The arrows are painted on the current bar (and not afterward!!), but at the highest or lowest price of the last 3 bars. If you want the arrows to be plotted at Close: drawarrowdown(barindex,close) coloured(255,0,0)
No worries!
What I meant is when I create an assisted ProBacktest it won’t take any trades if I set Buy to:
When Price, (or high, or close) = Reversal Point Indic (25 25 20), Buy 10 per point.
I had also tried:
When Reversal Point Indic (25 25 20), = Reversal Point Indic (25 25 20), Buy 10 per point… but of course it just buys every single bar regardless of where the drawarrowup and drawarrowdown arrows are on the chart.
So if I want to get it to buy (and sell) at the exact points where those drawarrowup and drawarrowdown markers are on the price chart how do I set the conditions in assisted creation?
(I did try your suggestion aswell and used barindex,close, but it takes no trades).
Cheers,
Bonsoir, y a t il un screener pour cet indicateur?
Is this for AmiBroker? I got some errors!!!
Sorry no! all codes on our website is to be used with ProRealTime trading platform: https://www.prorealtime.com
Bonjour
J’ai importé le fichier ITF en question, mais cela me donne, en bas de l’écran, un indicateur et non pas une indication sur la bougie de prix
Que dois je modifier ?
Merci pour réponse
Il faut ajouter l’indicateur sur le graphique du prix.
This is a great indicator, works very well!! Is there any algo based on this indicator that can take trades according to the signals?