RMI Trend Sniper: An Innovative Trading Indicator
The RMI Trend Sniper indicator is designed to identify market trends and trading signals with remarkable precision.
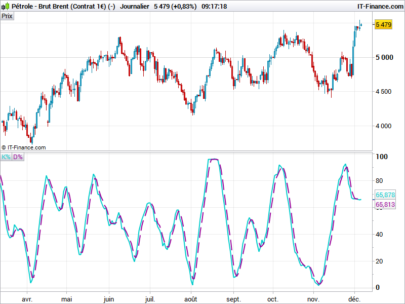
This tool combines the analysis of the Relative Strength Index (RSI) with the Money Flow Index (MFI) and a unique approach to range-weighted moving average to offer a comprehensive perspective on market dynamics.
Configuration and Indicator Parameters
The RMI Trend Sniper allows users to adjust various parameters according to their trading needs, including:
- RMI Length: Defines the calculation period for the RMI.
- Positive and Negative Momentum (Positive above / Negative below): Sets thresholds to determine the strength of bullish and bearish trends.
- Range MA Visualization (Show Range MA): Enables users to visualize the range-weighted moving average, along with color indications to quickly identify the current market trend.
How the Indicator Works
The RMI Trend Sniper is based on the modified RSI and MFI calculation logic to assess buying or selling pressure in the market.
Through a weighted average, the indicator adjusts sensitivity to price changes, providing more accurate signals.
The inclusion of an analysis based on the range of bars (Bar Range) allows for a detailed visual representation of price fluctuations, highlighting areas of potential trend reversal or continuation.
Interpretation of Signals
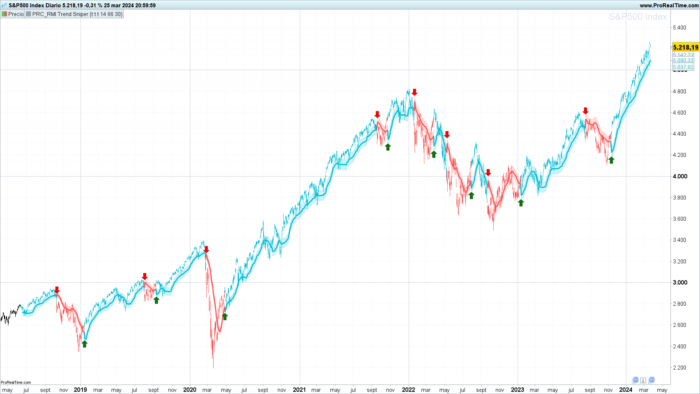
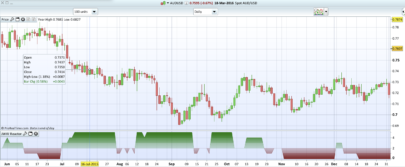
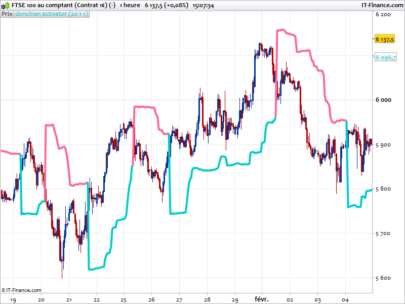
The signals generated by the RMI Trend Sniper are displayed on the chart as changes in the color of the bars and moving averages, along with labels marking the suggested entry points:
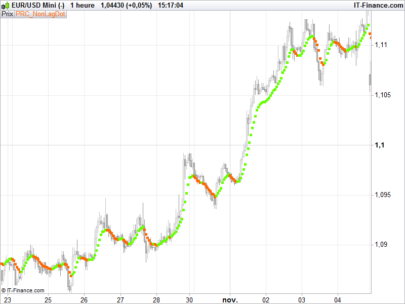
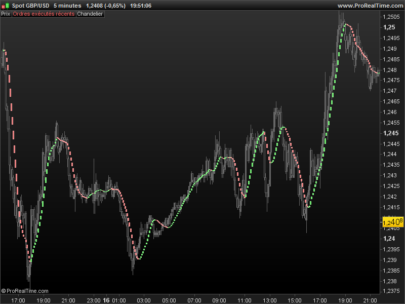
- Bullish Trend: Indicated by shades of blue and the appearance of green labels, suggesting an opportune moment to consider long positions.
- Bearish Trend: Signaled by shades of red and red labels, indicating potential opportunities to enter short positions.
Trading Strategies and Applications
The RMI Trend Sniper is suitable for a wide range of trading strategies, from scalping to swing trading, thanks to its ability to adapt to different time frames and markets. Traders can use this indicator to:
- Identify entry and exit points based on the strength and direction of the trend.
- Complement other technical analysis tools to confirm trading signals.
- Implement risk management strategies by identifying changes in market trend.
ProRealtime Code
|
1 2 3 4 5 6 7 8 9 10 11 12 13 14 15 16 17 18 19 20 21 22 23 24 25 26 27 28 29 30 31 32 33 34 35 36 37 38 39 40 41 42 43 44 45 46 47 48 49 50 51 52 53 54 55 56 57 58 59 60 61 62 63 64 65 66 67 68 69 70 71 72 73 74 75 76 77 78 79 80 81 82 83 84 85 86 87 88 89 90 91 92 93 94 95 96 97 98 99 100 101 102 103 104 |
//PRC_RMI Trend Sniper //version = 0 //26.03.24 //Iván González @ www.prorealcode.com //Sharing ProRealTime knowledge //-----Inputs----------------------------------------------// Length=14//RMI Length pmom=66//Positive above nmom=30//Negative below filleshow=1//Show Range MA colorbar=1//Color candles drawsignals=1//Show arrows //-----RSI and MFI calculation-----------------------------// alpha = 1/length //-----Up src1 = max(close-close[1],0) if barindex = length then up = average[length](src1) else up = alpha*src1 + (1-alpha)*up[1] endif //-----Down src2 = - min(close-close[1],0) if barindex = length then down = average[length](src2) else down = alpha*src2 + (1-alpha)*down[1] endif //-----Rsi if down = 0 then myrsi = 100 elsif up = 0 then myrsi = 0 else myrsi = 100 - (100/(1+up/down)) endif //-----MFI mfi = MoneyFlowIndex[length] //-----RsiMfi rsimfi = (myrsi+mfi)/2 //----------------------------------------------------------// //-----Long Short Conditions--------------------------------// ema = average[5,1](close) bpmom = rsimfi[1]<pmom and rsimfi>pmom and rsimfi>nmom and (ema-ema[1])>0 bnmom = rsimfi<nmom and (ema-ema[1])<0 if bpmom then positive = 1 negative = 0 elsif bnmom then positive = 0 negative = 1 endif //----------------------------------------------------------// //------Calculate RWMA--------------------------------------// band = min(averagetruerange[30]*0.3,close*(0.3/100))[20]/2*8 barRange = high-low weight = BarRange/summation[20](BarRange) sum = summation[20](close*weight) tw = summation[20](weight) rwma = sum/tw if positive then rwma = rwma-band r=0 g=188 b=212 elsif negative then rwma = rwma+band r=255 g=82 b=82 else rwma = undefined endif //------------------------------------------------------------// //-----Calculate MA bands-------------------------------------// if filleshow then mitop = rwma+band mibot = rwma-band colorbetween(mitop,rwma,r,g,b,50) colorbetween(mibot,rwma,r,g,b,50) else mitop = rwma mibot = rwma endif //-----------------------------------------------------------// //-----Draw signals------------------------------------------// if drawsignals then if negative and not negative[1] then drawarrowdown(barindex,mitop+(band/2))coloured("red") elsif positive and not positive[1] then drawarrowup(barindex,mibot-(band/2))coloured("green") endif endif //-----------------------------------------------------------// //-----Color Candles-----------------------------------------// if colorbar then drawcandle(open,high,low,close)coloured(r,g,b) endif //-----------------------------------------------------------// return rwma as "Rwma"coloured(r,g,b)style(line,3), mitop as "Max"coloured(r,g,b,70)style(line,1),mibot as "Min" coloured(r,g,b,70)style(line,1) |
Share this
No information on this site is investment advice or a solicitation to buy or sell any financial instrument. Past performance is not indicative of future results. Trading may expose you to risk of loss greater than your deposits and is only suitable for experienced investors who have sufficient financial means to bear such risk.
ProRealTime ITF files and other attachments :
Find other exclusive trading pro-tools on ![]()
PRC is also on YouTube, subscribe to our channel for exclusive content and tutorials


Parece un excelente indicador, lo voy a analizar. Muchas Gracias
De nada!
merci ! which time frame would be the best .?
Depends on the asset you are trading, so you need to test it first.
Iván, muchas gracias. Es una gran ayuda la combinación de ambos índices, por lo que he visto funciona muy bien.
Hi Ivan, can you translate from tradingviwe the EMA TREND METER INDICATOR? It couid be interesting to add it under the chart in addiction with this indicator.
Thanks!
Hi
Yes I can. Please, create a new topic for that I will translate it.
Hi Ivan, I’ve created a new topic about the indicator: https://www.prorealcode.com/topic/ema-trend-meter-indicator/
Thanks!
Me parece muy buen indicador, y se complementa muy bien en mi sistema, ¿podrías crear un screener de este indicador? Muchas gracias por todo el material. Eres un crack!
Gracias! Para el screener sólo tienes que copiar el indicador y poner como condición de búsqueda lo que genera las flechas hacia arriba y hacia abajo. Por ejemplo, para localizar largos setup[positive and not positive[1]].
al crear el screener te dirá que hay variables que no se usan. Sólo tienes que eliminarlas y listo.
Muchas gracias Iván, ya lo he podido crear.
Hello Ivan, thank you very much for the indicator. An observation: would it be possible (and wise) to build a displacement function in this indicator? Thanks!