1. Introduction
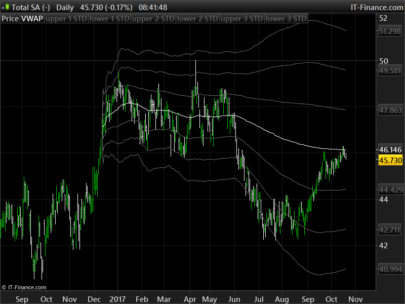
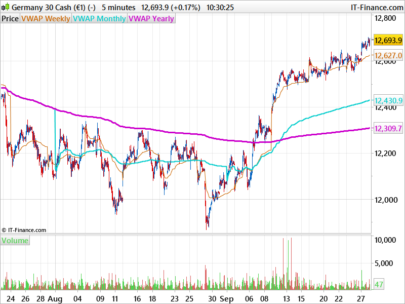
The Volume Weighted Average Price (VWAP) is a widely used technical analysis indicator that reflects the volume-weighted average price over a period of time. It is especially useful for traders because it provides a reference of fair value for an asset by taking into account both price and volume of transactions.
The Rolling VWAP, or dynamic VWAP, is a variant of the traditional VWAP that calculates the volume-weighted average price continuously over a defined number of bars. Instead of resetting at the beginning of each day, like a typical VWAP, the Rolling VWAP continuously recalculates over the most recent bars, allowing for a continuous and adaptive tracking of the asset’s value.
This article explores how the Rolling VWAP works, its key components, and how it can be used to improve precision in trading decisions.
2. Description of the Rolling VWAP Indicator
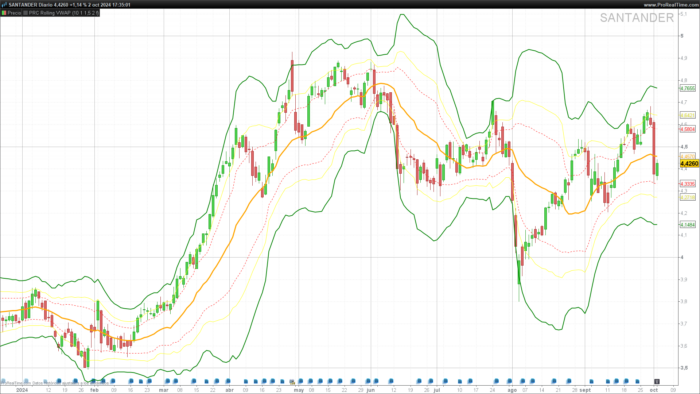
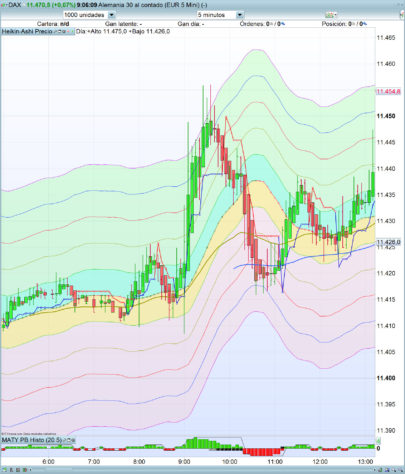
The Rolling VWAP combines the price and volume of recent bars to offer a dynamically adjusting volume-weighted average. By updating continuously, it provides a real-time view of the weighted average price, making it a useful tool for identifying trends as well as short-term support and resistance zones.
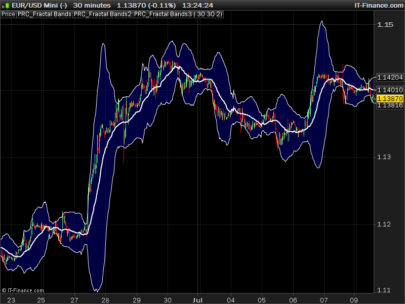
Additionally, the Rolling VWAP can be accompanied by standard deviation bands that help identify overbought and oversold zones. These bands provide a visual indication of where the price has moved away from its weighted average value, allowing traders to anticipate potential reversals or trend continuations.
Key Components of the Indicator:
- Data Source (
src): This is the price value used for the indicator’s calculations. By default, it uses the custom close price (customclose), but it can be adjusted depending on the trader’s needs. - Minimum Bars (
minBarsInput): This parameter defines the minimum number of bars to calculate the VWAP. The higher the number of bars, the more stable the Rolling VWAP value will be. - Standard Deviation Multipliers (
stdevMult1,stdevMult2,stdevMult3): These multipliers are used to define the standard deviation bands around the VWAP, helping traders identify potential support and resistance levels. - Show Bands (
showbands): An optional parameter to toggle the visibility of the standard deviation bands.
3. Indicator Settings
The Rolling VWAP can be configured according to the trader’s needs, adjusting several parameters to suit different trading styles or timeframes. The most important configurable parameters are:
1. Data Source (src):
The data source (src) is the price used to calculate the VWAP. Normally, the closing price is used, but it can be adjusted to other values such as the opening price, high, or low of each bar.
2. Minimum Bars (minBarsInput):
The minBarsInput parameter sets the minimum number of bars used to calculate the VWAP. A typical value might be 10, but it can be adjusted depending on the timeframe and market type. This value ensures that the calculation is stable enough to avoid excessive fluctuations in volatile markets.
3. Standard Deviation Multipliers (stdevMult1, stdevMult2, stdevMult3):
The Rolling VWAP includes three standard deviation bands adjustable through the multipliers:
- stdevMult1: Adjusts the first standard deviation band, representing a smaller deviation from the VWAP.
- stdevMult2: Adjusts the second standard deviation band, representing a more pronounced deviation.
- stdevMult3: Adjusts the third band, indicating an even larger deviation, useful for identifying extreme price movements.
4. Show Bands (showbands):
The indicator also includes the option to toggle the visibility of the standard deviation bands. This is useful when traders prefer a cleaner chart or only need the VWAP calculation without additional visual references.
4. Rolling VWAP Calculation
The Rolling VWAP calculation follows a dynamic structure, adapting to the timeframe being used. The number of bars used to calculate the VWAP adjusts depending on the current timeframe of the chart. Here’s how the calculation behaves across different timeframes:
- Intraday Timeframes: For timeframes shorter than a day, the number of bars equals the value of the
minBarsInputparameter. - Daily and Weekly Timeframes: For daily charts, a minimum of 22 bars is used, while weekly charts use up to 90 bars.
- Monthly Timeframes: On monthly charts, the Rolling VWAP uses up to 252 bars, equivalent to roughly one year of data.
This dynamic adjustment ensures that the VWAP remains relevant and effective across different market conditions and timeframes.
VWAP and Standard Deviation Calculation:
The Rolling VWAP is calculated as the sum of the price multiplied by the volume, divided by the total volume of the selected bars. The formula is:
RollingVWAP=∑(Price×Volume)/∑Volume
The standard deviation of the volume-weighted price is then calculated to generate the upper and lower bands, providing a measure of market volatility.
5. Rolling VWAP Bands
The bands that accompany the Rolling VWAP offer valuable visual references for traders. These bands are calculated using the standard deviation of prices relative to the VWAP and are multiplied by adjustable values to define levels of price deviation from the weighted average.
The bands can be interpreted as follows:
- Upper Bands: Indicate areas where the price may be overbought and potentially ready for a downward correction.
- Lower Bands: Represent areas where the price may be oversold, signaling potential buying opportunities.
By including three levels of bands with different standard deviation multipliers, the indicator allows traders to identify both short-term reversals and extreme price movements that may indicate the end of a trend.
6. Conclusion
The Rolling VWAP is a powerful tool for traders who want an adaptable indicator that not only provides a volume-weighted average price but also dynamic support and resistance levels through its standard deviation bands. Its ability to adjust to different timeframes and its versatility make it useful for both intraday trading and longer-term analysis.
This indicator can be an excellent addition to any trader’s toolkit, improving precision in identifying entry and exit points, as well as assessing the strength of a trend.
|
1 2 3 4 5 6 7 8 9 10 11 12 13 14 15 16 17 18 19 20 21 22 23 24 25 26 27 28 29 30 31 32 33 34 35 36 37 38 39 40 41 42 43 44 45 46 47 48 49 50 51 52 53 54 55 |
//PRC Rolling VWAP //version = 0 //06.03.24 //Iván González @ www.prorealcode.com //Sharing ProRealTime knowledge ///inputs src = customclose minBarsInput = 10 stdevMult1 = 1 stdevMult2 = 1.5 stdevMult3 = 2.5 showbands = 1 //////BARS TO CALCULATE VWAP///////// if gettimeframe < 86400 then bars = minbarsinput elsif gettimeframe >= 86400 and gettimeframe < 604800 then bars = MAX(22,minbarsinput) elsif gettimeframe = 604800 then bars = MAX(round(90/5),minbarsinput) else bars = MAX(round(252/22),minbarsinput) endif ////////////////////////////////////// sumSrcVol = summation[bars](src*volume) sumVol = summation[bars](volume) sumSrcSrcVol = summation[bars](pow(src,2)*volume) rollingvwap = sumSrcVol / SumVol variance = sumSrcSrcVol / SumVol - pow(rollingvwap,2) variance = max(0,variance) stDev = sqrt(variance) if showbands then upperband1 = rollingVwap + stDev*stdevMult1 lowerband1 = rollingVwap - stDev*stdevMult1 upperband2 = rollingVwap + stDev*stdevMult2 lowerband2 = rollingVwap - stDev*stdevMult2 upperband3 = rollingVwap + stDev*stdevMult3 lowerband3 = rollingVwap - stDev*stdevMult3 else upperband1 = undefined lowerband1 = undefined upperband2 = undefined lowerband2 = undefined upperband3 = undefined lowerband3 = undefined endif return rollingvwap as "rollingVwap" coloured("orange"),upperband1 as "upperband1"coloured("red"),lowerband1 as "lowerband1"coloured("red"),upperband2 as "upperband2"coloured("yellow"),lowerband2 as "lowerband2"coloured("yellow"),upperband3 as "upperband3"coloured("green"),lowerband3 as "lowerband3"coloured("green") |
Share this
No information on this site is investment advice or a solicitation to buy or sell any financial instrument. Past performance is not indicative of future results. Trading may expose you to risk of loss greater than your deposits and is only suitable for experienced investors who have sufficient financial means to bear such risk.
ProRealTime ITF files and other attachments :
Find other exclusive trading pro-tools on ![]()
PRC is also on YouTube, subscribe to our channel for exclusive content and tutorials


Hi Ivan, I can visualize only the central orange line but not the others, do you know why? can you help me?
Thanks