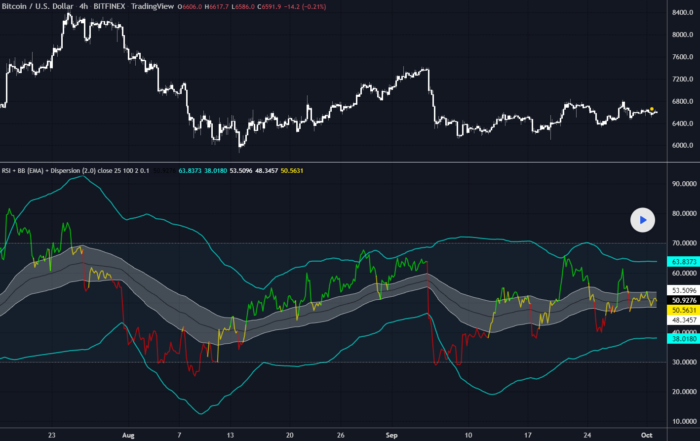
Just another RSI with 2 bollinger bands. Coded following a request in the indicator forum section.
Initial data:
1) RSI
2) Bollinger Bands (Basis – EMA )
3) Dispersion (around basis)
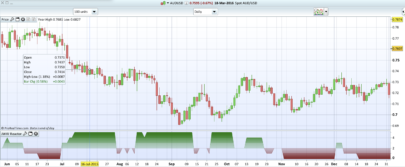
Signal for purchase: RSI crosses the dispersion zone upwards
Signal for sale: RSI crosses the dispersion zone downwards
Buffer zone: white area, it is not recommended to make transactions.
— Add (02.10.2018)
1) RSI lines (overbought / oversold) = 70 / 30. Сan be changed in the settings.
2) Alerts:
• RSI line crossover Dispersion Zone (green)
• RSI line crossunder Dispersion Zone (red)
|
1 2 3 4 5 6 7 8 9 10 11 12 13 14 15 16 17 18 19 20 21 22 23 24 25 26 27 28 29 30 31 32 33 34 35 36 37 38 |
//PRC_RSI+BB (EMA)+Dispersion | indicator //05.09.2022 //Nicolas @ www.prorealcode.com //Sharing ProRealTime knowledge //converted from pinescript // --- settings forrsi = 14 //RSI_period forma = 20 //Basis_BB formult = 2 // Stdev forsigma = 0.1 //Dispersion // --- end of settings src = customclose currentrsi = rsi[forrsi](src) basis = average[forma](currentrsi) dev = formult * std[forma](currentrsi) upper = basis + dev lower = basis - dev dispup = basis + ((upper - lower) * forsigma) dispdown = basis - ((upper - lower) * forsigma) if currentrsi>=dispup then r=0 g=255 elsif currentrsi<=dispdown then r=255 g=0 else r=255 g=234 endif colorbetween(70,30,"white",95) colorbetween(dispup,dispdown,"white",80) return 70 coloured(212,212,212,95) style(dottedline),30 coloured(212,212,212,95) style(dottedline), currentrsi coloured(r,g,0) style(line,2), basis, upper style(line,2) coloured(0,255,240), lower style(line,2) coloured(0,255,240), dispup coloured("white"), dispdown coloured("white") |
Share this
No information on this site is investment advice or a solicitation to buy or sell any financial instrument. Past performance is not indicative of future results. Trading may expose you to risk of loss greater than your deposits and is only suitable for experienced investors who have sufficient financial means to bear such risk.
ProRealTime ITF files and other attachments :
Find other exclusive trading pro-tools on ![]()
PRC is also on YouTube, subscribe to our channel for exclusive content and tutorials


Thank you Nicolas! Looks like TDI (Trader Dynamic Index). Interesting to give Exit Signal as well. Is “colorbetween” a new instruction on PRT?
ColorBetween is an instruction added last year: https://www.prorealcode.com/documentation/colorbetween/
Bonjour, serait-il possible de remplacer l’écart formé par les bandes de Bollinger par l’ATR ?
merci.