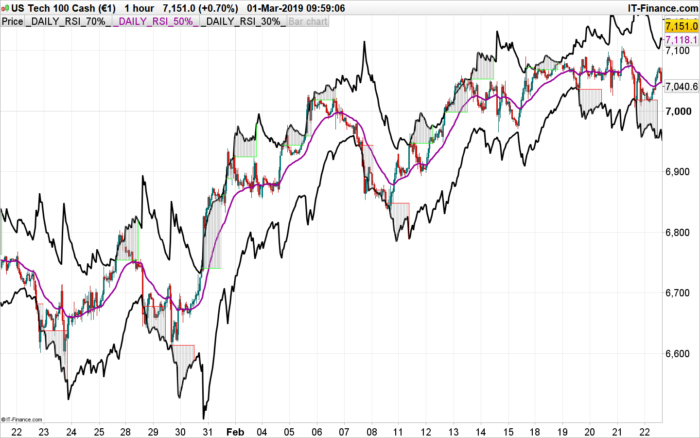
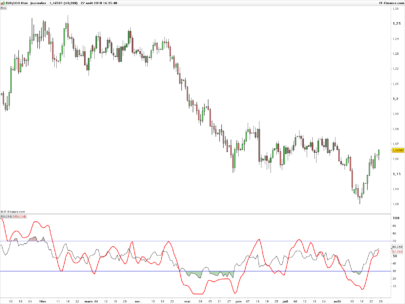
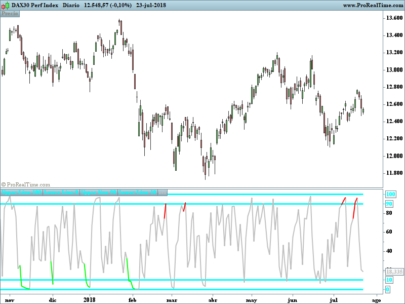
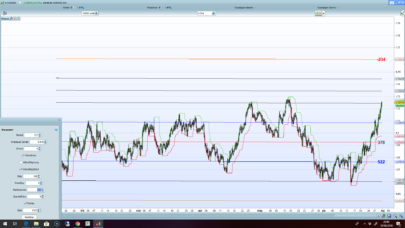
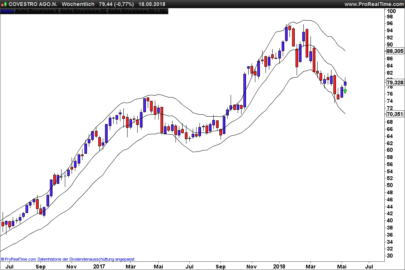
This indicator spot the touch/breakout/reversion of the price with its channel upper and lower bounds made from the reverse engineered version of RSI by our member Louis Winthorp III: RSI Reverse Engineering indicator
Once the price has touched one of the band a “cage” is plotted during “levelperiod” candlesticks to easily spot the breakout of the price in the same direction of the reverse to the mean of the price.
RSIperiod and AveragePeriod of the channel can be modified in the settings.
Original idea from this topic: breakout of RSI channel
|
1 2 3 4 5 6 7 8 9 10 11 12 13 14 15 16 17 18 19 20 21 22 23 24 25 26 27 28 29 30 31 32 33 34 35 36 37 38 39 40 41 42 43 44 45 46 47 48 49 50 51 52 53 54 55 56 57 58 59 60 61 62 63 64 65 66 67 68 69 70 71 72 73 74 75 76 77 78 79 80 81 82 83 84 85 |
//PRC_RSI Channel Ob/Os Breakout | indicator //01.03.2019 //Nicolas @ www.prorealcode.com //Sharing ProRealTime knowledge // --- settings AveragePeriod = 14 RSIperiod = 14 levelperiod = 20 // --- end of settings ////////////////////////////////////////////////// //_RSI_LEVELS_ ONCE RSI70 = UNDEFINED ONCE RSI30 = UNDEFINED RSIORI = RSI[RSIperiod](CLOSE) UPORI = MAX(0,CLOSE-CLOSE[1]) DOWNORI = MAX(0,CLOSE[1]-CLOSE) UPMAORI = WILDERAVERAGE[AveragePeriod](UPORI) DOWNMAORI = WILDERAVERAGE[AveragePeriod](DOWNORI) RSREV = (100/((-1*70)+100)) - 1 IF 70 < RSIORI THEN UPMAREV = UPMAORI * (1-(1/14)) DOWNMAREV = UPMAREV / RSREV DOWNREV = (DOWNMAREV-(DOWNMAORI*(1-(1/14))))/(1/14) RSI70 = CLOSE - DOWNREV ELSIF 70 > RSIORI THEN DOWNMAREV = DOWNMAORI * (1-(1/14)) UPMAREV = DOWNMAREV * RSREV UPREV = (UPMAREV-(UPMAORI*(1-(1/14))))/(1/14) RSI70 = CLOSE + UPREV ENDIF RSI50 = WILDERAVERAGE[AveragePeriod](CLOSE) RSIORI2 = RSI[RSIperiod](CLOSE) UPORI2 = MAX(0,CLOSE-CLOSE[1]) DOWNORI2 = MAX(0,CLOSE[1]-CLOSE) UPMAORI2 = WILDERAVERAGE[AveragePeriod](UPORI2) DOWNMAORI2 = WILDERAVERAGE[AveragePeriod](DOWNORI2) RSREV2 = (100/((-1*30)+100)) - 1 IF 30 < RSIORI2 THEN UPMAREV2 = UPMAORI2 * (1-(1/14)) DOWNMAREV2 = UPMAREV2 / RSREV2 DOWNREV2 = (DOWNMAREV2-(DOWNMAORI2*(1-(1/14))))/(1/14) RSI30 = CLOSE - DOWNREV2 ELSIF 30 > RSIORI2 THEN DOWNMAREV2 = DOWNMAORI2 * (1-(1/14)) UPMAREV2 = DOWNMAREV2 * RSREV2 UPREV2 = (UPMAREV2-(UPMAORI2*(1-(1/14))))/(1/14) RSI30 = CLOSE + UPREV2 ENDIF //low break if low crosses under RSI30 then lowstartbar=barindex lowstartlevel=rsi30 endif if lowstartbar>0 and barindex-lowstartbar<=levelperiod then drawsegment(lowstartbar,lowstartlevel,barindex,lowstartlevel) coloured(255,0,0) drawbarchart(lowstartlevel,lowstartlevel,lowstartlevel,rsi30) coloured(160,160,160,150) endif if barindex-lowstartbar=levelperiod then drawsegment(barindex,lowstartlevel,barindex,RSI30) coloured(255,0,0) endif //high break if high crosses over RSI70 then highstartbar=barindex highstartlevel=rsi70 endif if highstartbar>0 and barindex-highstartbar<=levelperiod then drawsegment(highstartbar,highstartlevel,barindex,highstartlevel) coloured(0,255,0) drawbarchart(highstartlevel,highstartlevel,highstartlevel,rsi70) coloured(160,160,160,200) endif if barindex-highstartbar=levelperiod then drawsegment(barindex,highstartlevel,barindex,RSI70) coloured(0,255,0) endif RETURN RSI70 COLOURED (0,0,0) STYLE (LINE,3) AS "_DAILY_RSI_70%_", RSI50 COLOURED (153,0,153) STYLE (LINE,3) AS "_DAILY_RSI_50%_", RSI30 COLOURED (0,0,0) STYLE (LINE,3) AS "_DAILY_RSI_30%_" |
Share this
No information on this site is investment advice or a solicitation to buy or sell any financial instrument. Past performance is not indicative of future results. Trading may expose you to risk of loss greater than your deposits and is only suitable for experienced investors who have sufficient financial means to bear such risk.
ProRealTime ITF files and other attachments :
Find other exclusive trading pro-tools on ![]()
PRC is also on YouTube, subscribe to our channel for exclusive content and tutorials


Sympa cet indicateur. 🙂
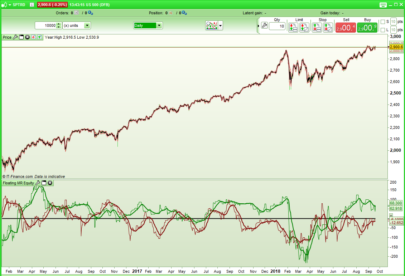
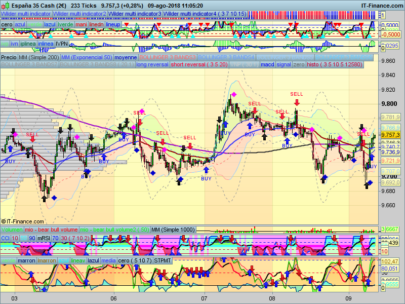
J’ai mis une autre idée pour ce canal RSI (et aussi pour le canal de Donchian) afin de tracer des niveaux pertinents, je le remets là (capture sur l’autre sujet, je n’arrive pas à la mettre là):
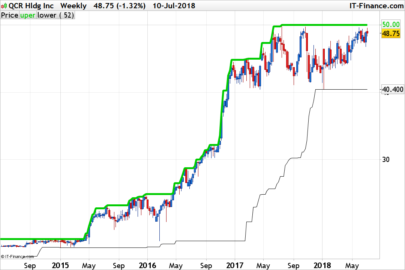
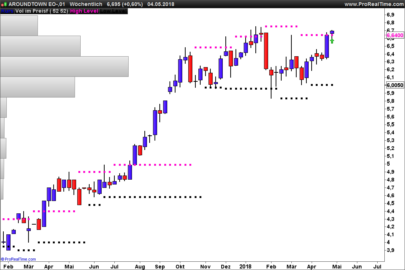
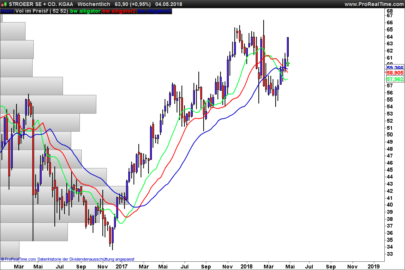
1/ – Tracé d’un nouveau plus haut lors d’un breakout haussier.
– Si le prix retouche la WMA14 (qu’on pourra remplacer par un autre indicateur de tendance au choix, etc…), un nouveau plus haut peut être établis, ou un nouveau plus bas.
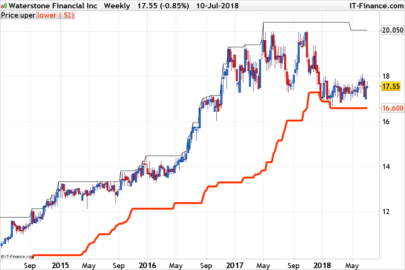
2/ – Tracé d’un nouveau plus bas lors d’un breakout baissier.
– Si le prix retouche la WMA14, un nouveau plus bas peut être établis, ou un nouveau plus haut.”
Je sais que tu utilises les affichages de niveaux avec les outils graphiques drawsegment, si cela est possible de les mettre en dur ça serait plus pratique, mais si tu ne l’as pas fait c’est que ce n’est peut-être pas faisable.
Merci ! 😉
1/ – Tracé d’un nouveau plus haut lors d’un breakout haussier.
– Si le prix retouche la WMA14 (qu’on pourra remplacer par un autre indicateur de tendance au choix, etc…), un nouveau plus haut peut être établis, ou un nouveau plus bas —> au prochain contact avec l’une des 2 bornes du canal RSI.
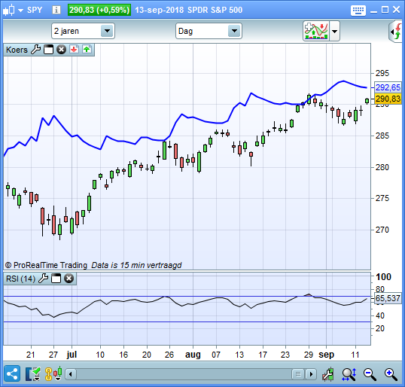
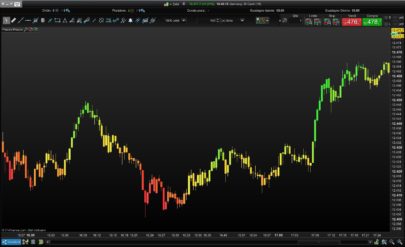
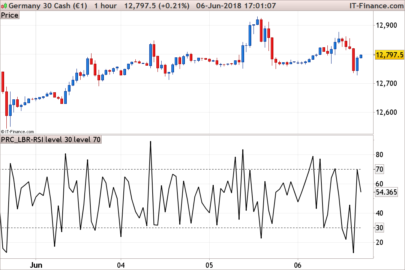
Bonjour à tous, Je suis nouveau sur le forum et sur la plateforme, pourriez-vous me dire comment insérer cet indicateur dans le graphique? Je l’ai importé dans le graphique, mais il s’ouvre sous le graphique en chandeliers. Je voudrais l’insérer au-dessus des prix, comme je le vois dans l’image ci-jointe. Je vous remercie beaucoup
Mon respect pour votre travail
Il faut simplement l’appliquer sur le prix.
Merci pour la réponse, je ne suis pas familier avec l’application de cette procédure simple, mais je vais essayer.