
1. Introduction
The Relative Strength Index (RSI) is one of the most widely used indicators in technical analysis, originally developed by J. Welles Wilder. Its main function is to measure the relative strength of an asset by comparing upward and downward price movements over a specific period. Traditionally, the RSI is used to identify overbought (levels above 70) and oversold (levels below 30) conditions, as well as potential trend reversals.
However, the classic RSI has limitations in markets with dominant cycles or irregular trends, as its standard calculation can produce less accurate signals. To improve its performance, the RSI Cyclic Smoothed (CRSI) was created, an advanced version that incorporates cyclic smoothing and cyclic memory to better adapt to market movements.
The RSI Cyclic Smoothed not only smooths the original RSI but also calculates dynamic bands (UpperBand and LowerBand), which adjust automatically to the asset’s cyclical levels, providing clearer signals in varying market conditions.
In this article, we will analyze how this indicator works, how to interpret it, and how you can configure it in the ProRealTime platform. Finally, the complete code in ProBuilder will be included for you to implement it in your charts.
2. How the RSI Cyclic Smoothed Works
The RSI Cyclic Smoothed (CRSI) is an advanced version of the classic RSI that incorporates two key elements to improve its performance: cyclic smoothing and cyclic memory. This allows it to adapt better to market cycles and offer more accurate signals compared to the standard RSI. Below, we break down its operation step by step:
2.1 Basic Calculation Concepts
- Cycle Dominance (domcycle):
Defines the duration of the dominant market cycle. This parameter is fundamental for adjusting the indicator’s sensitivity. The cycle is divided into two parts:- cyclelen = domcycle / 2 (half of the cycle length).
- vibration: Smooths the RSI behavior by eliminating noise.
- Cyclic Memory:
Represents the period over which the CRSI history is stored to calculate dynamic reference levels. The cyclic memory is defined as:- cyclicmemory = domcycle * 2
2.2 RSI Smoothing
The process begins with calculating the classic RSI, but instead of using a fixed period, an exponential smoothing factor is introduced to reduce fluctuations:
- Calculating “up” and “down” movements:
srcUp = max(src - src[1], 0)→ Upward movement.srcDw = -min(src - src[1], 0)→ Downward movement.
- Applying exponential smoothing (alpha):
Exponential smoothing replaces the traditional average:
1234567if barindex = length thenup = average[length](srcUp)dw = average[length](srcDw)elseup = alpha * srcUp + (1 - alpha) * up[1]dw = alpha * srcDw + (1 - alpha) * dw[1]endif
Where:- alpha = 1 / cyclelen (based on the dominant cycle).
- RSI Calculation:
- If there are no downward movements (
dw = 0), RSI = 100. - If there are no upward movements (
up = 0), RSI = 0. - Otherwise, RSI follows the standard formula:
- If there are no downward movements (
|
1 |
myrsi = 100 - 100 / (1 + up / dw) |
2.3 Cyclic Memory and Phase Adjustment
To synchronize the RSI with market cycles, a phase adjustment is introduced using the vibration parameter:
- Torque (Cyclic Smoothing Factor):
|
1 |
torque = 2 / (vibration + 1) |
- Phase Lag:
Calculates a lag based on half the vibration parameter:
|
1 |
phasinglag = floor((vibration - 1) / 2) |
- CRSI Calculation:
The CRSI smooths and adjusts the original RSI:
|
1 |
crsi = torque * (2 * myrsi - myrsi[phasinglag]) + (1 - torque) * crsi[1] |
2.4 Dynamic Bands (UpperBand and LowerBand)
A unique feature of the RSI Cyclic Smoothed is the incorporation of dynamic bands, calculated based on the CRSI. These bands provide reference levels that adjust to the asset’s cyclical behavior:
- UpperBand: Represents the CRSI’s recent maximum level.
- LowerBand: Represents the CRSI’s recent minimum level.
The bands are determined by analyzing the CRSI history over the cyclic memory period:
|
1 2 3 4 5 |
for i = 0 to periodMinusone do if crsi[i] > maxima then maxima = crsi[i] if crsi[i] < minima then minima = crsi[i] next |
The stepfactor adjusts the precision of these levels:
|
1 2 |
stepfactor = (maxima - minima) / 100 |
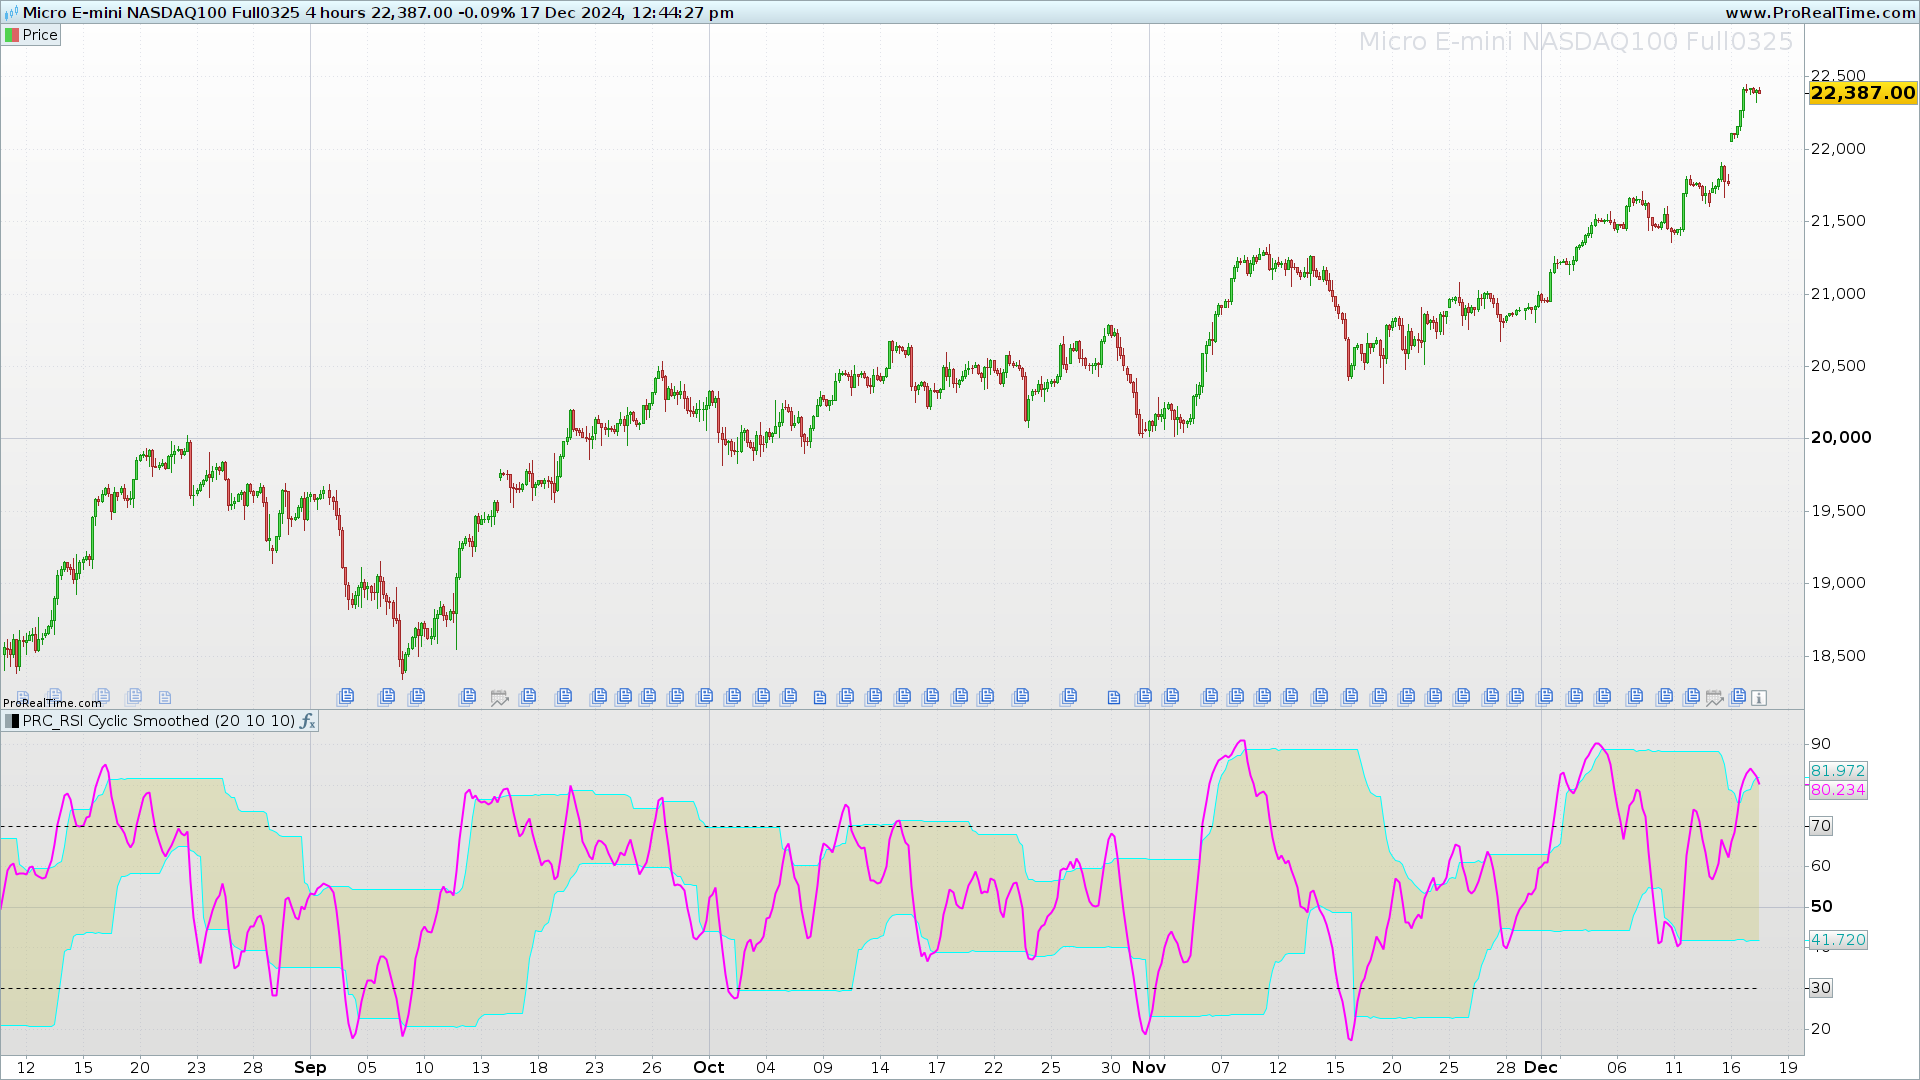
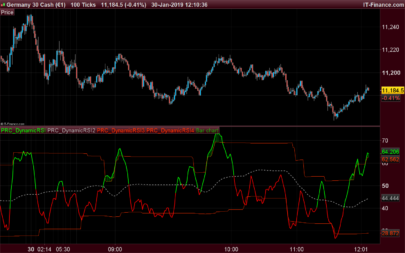
3. Indicator Interpretation
3.1 Overbought and Oversold Levels
- Static Reference Levels:
- Above 70 → Overbought: Possible bearish reversal.
- Below 30 → Oversold: Possible bullish reversal.
3.2 Dynamic Bands
- UpperBand: Indicates extreme overbought conditions when CRSI crosses above this level.
- LowerBand: Indicates extreme oversold conditions when CRSI crosses below this level.
3.3 Shaded Area Between Bands
The area between the UpperBand and LowerBand is highlighted for clarity, helping to identify consolidation or range-bound cycles.
4. Indicator Configuration
| Parameter | Default Value | Description |
|---|---|---|
| domcycle | 20 | Duration of the dominant market cycle. |
| vibration | 10 | Smooths CRSI by reducing noise. |
| leveling | 10 | Controls the precision of dynamic bands. |
| cyclicmemory | domcycle * 2 | Historical period used to calculate dynamic bands. |
5. Practical Tips
- Trial and Error: Adjust parameters gradually to optimize the indicator for your asset and timeframe.
- Adaptation to Asset: Customize settings based on the asset’s volatility and cyclical behavior.
- Timeframe: Use smaller values for intraday charts and larger values for weekly or monthly charts.
6. Conclusion
The RSI Cyclic Smoothed is a powerful enhancement to the classic RSI, offering greater adaptability through cyclic smoothing and dynamic bands. Its ability to adjust to market cycles makes it a valuable tool for identifying overbought/oversold conditions and potential trend reversals. By fine-tuning its parameters, you can optimize its performance across different timeframes and market environments.
|
1 2 3 4 5 6 7 8 9 10 11 12 13 14 15 16 17 18 19 20 21 22 23 24 25 26 27 28 29 30 31 32 33 34 35 36 37 38 39 40 41 42 43 44 45 46 47 48 49 50 51 52 53 54 55 56 57 58 59 60 61 62 63 64 65 66 67 68 69 70 71 72 73 74 75 76 77 78 79 80 81 82 83 84 85 86 87 88 89 90 91 92 93 94 95 96 97 98 99 100 101 102 103 104 105 106 107 |
//-------------------------------------// //PRC_RSI Cyclic Smoothed //version = 0 //19.11.2024 //Iván González @ www.prorealcode.com //Sharing ProRealTime knowledge //-------------------------------------// //Inputs //-------------------------------------// src=close domcycle=20 cyclelen=domcycle/2 vibration=10 leveling=10 cyclicmemory=domcycle*2 once crsi=0 //-------------------------------------// // CRSI calculation //-------------------------------------// torque=2/(vibration+1) phasinglag=floor((vibration-1)/2) length = cyclelen alpha = 1/length srcUp = max(src-src[1],0) if barindex = length then up = average[length](srcUp) else up = alpha*srcUp + (1-alpha)*up[1] endif srcDw = -min(src-src[1],0) if barindex = length then dw = average[length](srcdw) else dw = alpha*srcdw + (1-alpha)*dw[1] endif if dw=0 then myrsi=100 elsif up=0 then myrsi=0 else myrsi=100-100/(1+up/dw) endif if barindex>cyclicmemory then crsi=torque*(2*myrsi-myrsi[phasinglag])+(1-torque)*crsi[1] endif //-------------------------------------// // LowBand and HighBand calculation //-------------------------------------// Period=cyclicMemory percent = leveling/100 periodMinusone = period-1 maxima = -999999.0 minima = 999999.0 for i=0 to periodMinusone do if crsi[i] > maxima then maxima = crsi[i] elsif crsi[i] < minima then minima = crsi[i] endif next stepfactor = (maxima-minima)/100 lowband = 0 for steps=0 to 100 do testvalue = minima+stepfactor*steps below=0 for m=0 to periodMinusone do if crsi[m]<testvalue then below=below+1 endif next if below/period >= percent then lowband = testvalue break endif next highband=0 for steps=0 to 100 do testvalue=maxima-stepfactor*steps above=0 for m=0 to periodMinusone do if crsi[m]>=testvalue then above=above+1 endif next if above/Period >= percent then highband=testvalue break endif next colorbetween(highband,lowband,204,204,119,90) //-------------------------------------// // Plot //-------------------------------------// h1=30 h2=70 //-------------------------------------// return highband as "UpperBand"coloured("aqua"),lowband as "LowerBand"coloured("aqua"),crsi as "CRSI"coloured("fuchsia")style(line,2), h1 as "OB level"style(dottedline), h2 as "OS level"style(dottedline) |
Share this
No information on this site is investment advice or a solicitation to buy or sell any financial instrument. Past performance is not indicative of future results. Trading may expose you to risk of loss greater than your deposits and is only suitable for experienced investors who have sufficient financial means to bear such risk.
ProRealTime ITF files and other attachments :
Find other exclusive trading pro-tools on ![]()
PRC is also on YouTube, subscribe to our channel for exclusive content and tutorials


Gracias!