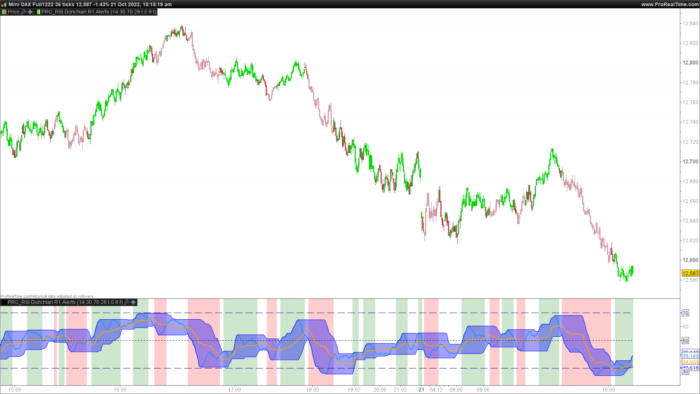
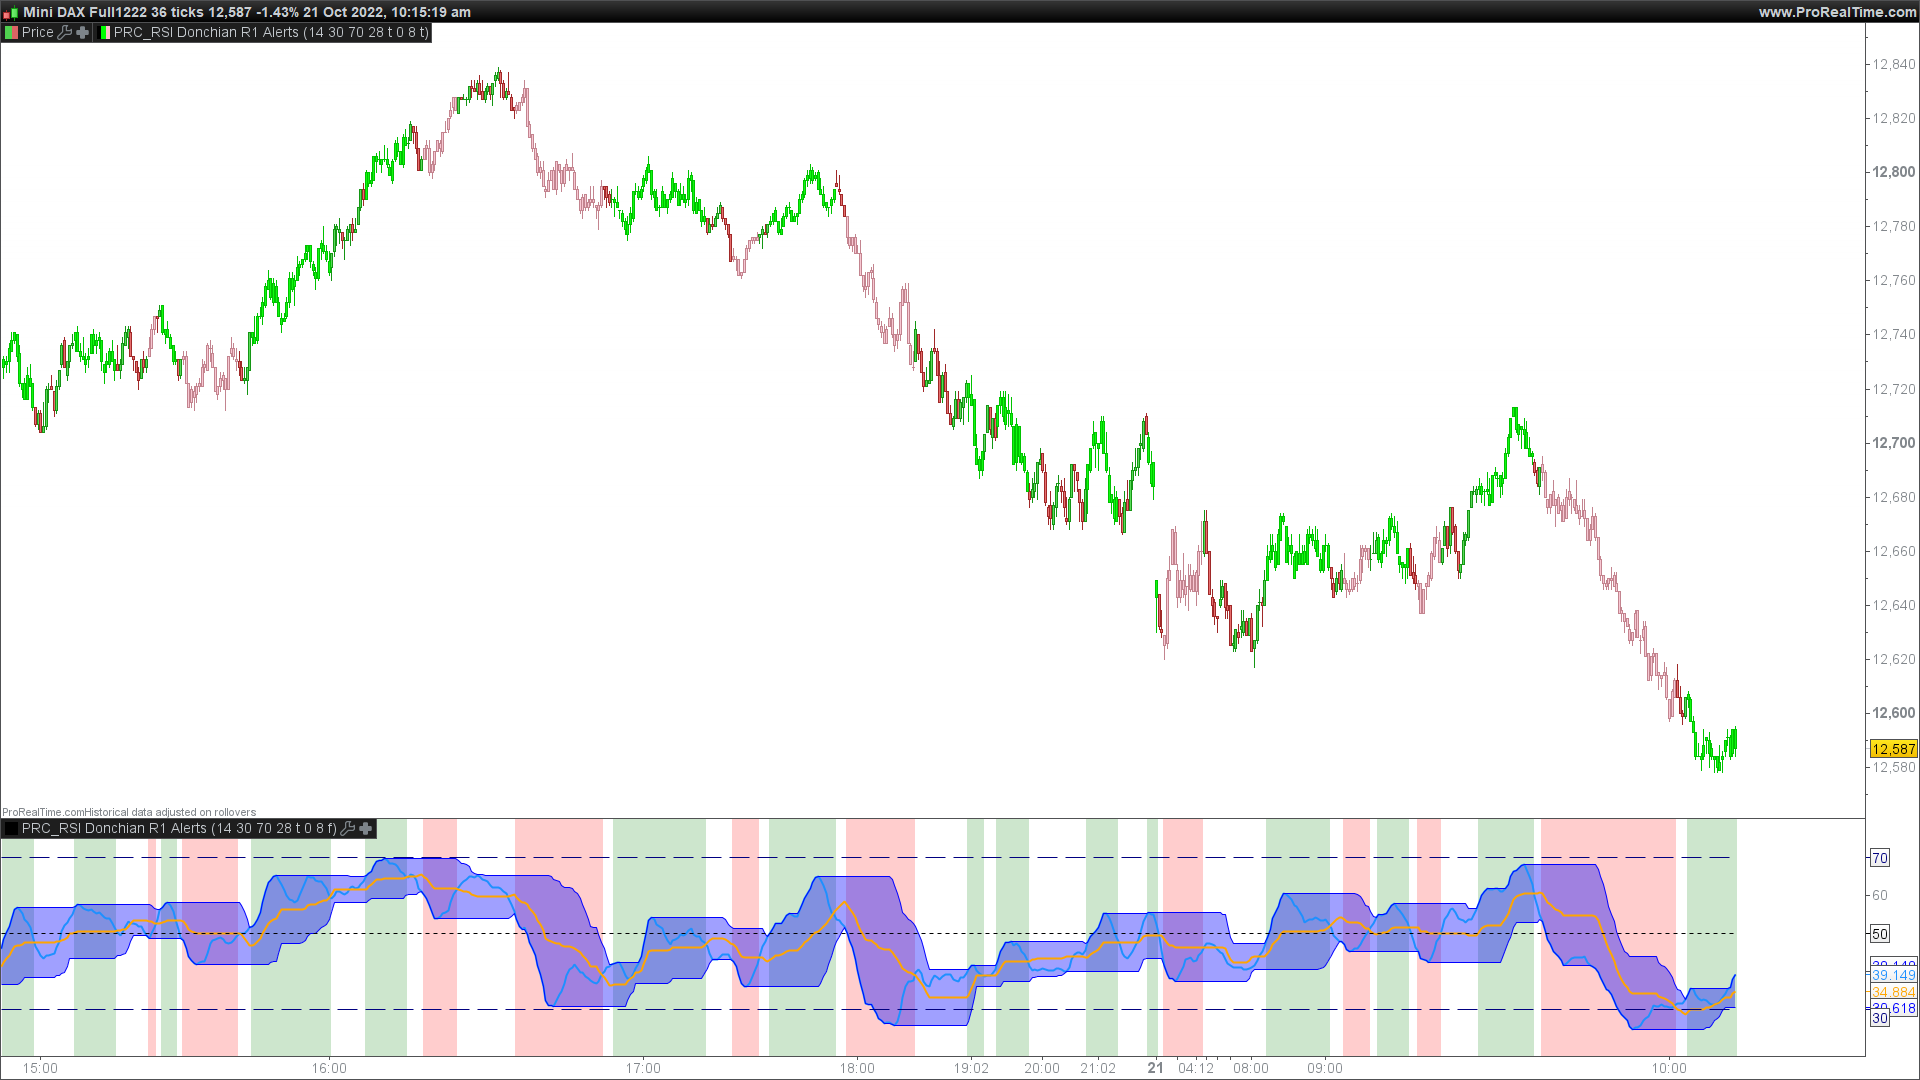
Donchian Channel (DC) on the RSI curve. The idea being that when RSI passes through the DC centre and touches the Highest/Lowest DC then price action tends to follow in the same direction and stay there until the RSI crosses DC centre line again.
There is also the option of applying MA smoothing to the RSI curve, the HullMA (8) is recommended (default).
(description from original author: JustUncleL)
|
1 2 3 4 5 6 7 8 9 10 11 12 13 14 15 16 17 18 19 20 21 22 23 24 25 26 27 28 29 30 31 32 33 34 35 36 37 38 39 40 41 42 43 44 45 46 47 48 49 50 51 52 53 54 55 56 57 58 59 60 61 62 63 64 65 66 67 68 69 70 |
//PRC_RSI Donchian R1 Alerts | indicator //21.10.2022 //Nicolas @ www.prorealcode.com //Sharing ProRealTime knowledge //converted from pinescript // --- settings rsilength = 14 //RSI Period Length rsios =30 //RSI Oversold Level rsiob = 70 //RSI Overbought Level donlength = 28 //Donchian Channel Lookback Length uSmooth = 0 //Apply MA Smoothing to RSI matype = 7 // MA type (0=SMA,1=EMA,2=WMA,3=Wilder,4=Triangular,5=End point,6=Time series,7 = Hull (PRT v11 only),8 = ZeroLag (PRT v11 only)) malen =8 //RSI MA Smooth - Length sBars = 0 //Colour Candles? // --- end of settings src = customclose // RSI calc iRSI = rsi[rsilength](src) // Smooth RSI if selected if uSmooth then maseries = average[malen,matype](iRSI) ELSE maseries = irsi endif // Calculate RSI Donchian Channel lower = lowest[donlength](maseries) upper = highest[donlength](maseries) basis = (lower+upper)/2 // Look for Touches and Breaks of upper and lower channel breakAbove = maseries >= upper[1] breakBelow = maseries <= lower[1] breakAboveB = maseries crosses over basis[1] breakBelowB = maseries crosses under basis[1] if breakabove then trend=1 endif if breakbelow then trend=-1 endif if breakaboveb or breakbelowb then trend=0 endif if not sbars then if trend = 1 then BACKGROUNDCOLOR ("green",50) elsif trend = -1 then BACKGROUNDCOLOR ("red",50) endif endif colorbetween(upper,lower,"blue",95) if sbars then if trend =1 then drawcandle(open,high,low,close) coloured("lime") elsif trend=-1 then drawcandle(open,high,low,close) coloured("pink") endif endif return maseries coloured("dodgerblue") style(line,2) as "RSI curve",upper coloured("blue") as "Upper DC Band", lower coloured("blue") as "Lower DC Band", basis coloured("orange") style(line,2) as "DC Mid-Line",50 style(dottedline) as "RSI Centre",rsios style(dottedline1) coloured("navy") as "RSI lower boundary" , rsiob style(dottedline1) coloured("navy") as "RSI upper boundary" |
Share this
No information on this site is investment advice or a solicitation to buy or sell any financial instrument. Past performance is not indicative of future results. Trading may expose you to risk of loss greater than your deposits and is only suitable for experienced investors who have sufficient financial means to bear such risk.
ProRealTime ITF files and other attachments :PRC is also on YouTube, subscribe to our channel for exclusive content and tutorials









Bonjour , Nicolas , je voudrais installer cet indicateur sur ma PRT , version 10.3 , mais je pense qu’il ne peut fonctionner que sur la V11 . Merci pour ta réponse et bonne journée .
En effet, il faut à minima une version 11. La 10.3 est tellement ancienne maintenant.. Je pense que ça pourrait fonctionner en supprimant les lignes 52 à 68…
Bonjour , Nicolas , merci pour ta réponse , je fais un essai et je verrais . Salutations .