RSI MultiPeriods HeatMap

v10.3
RSI MultiPeriods HeatMap

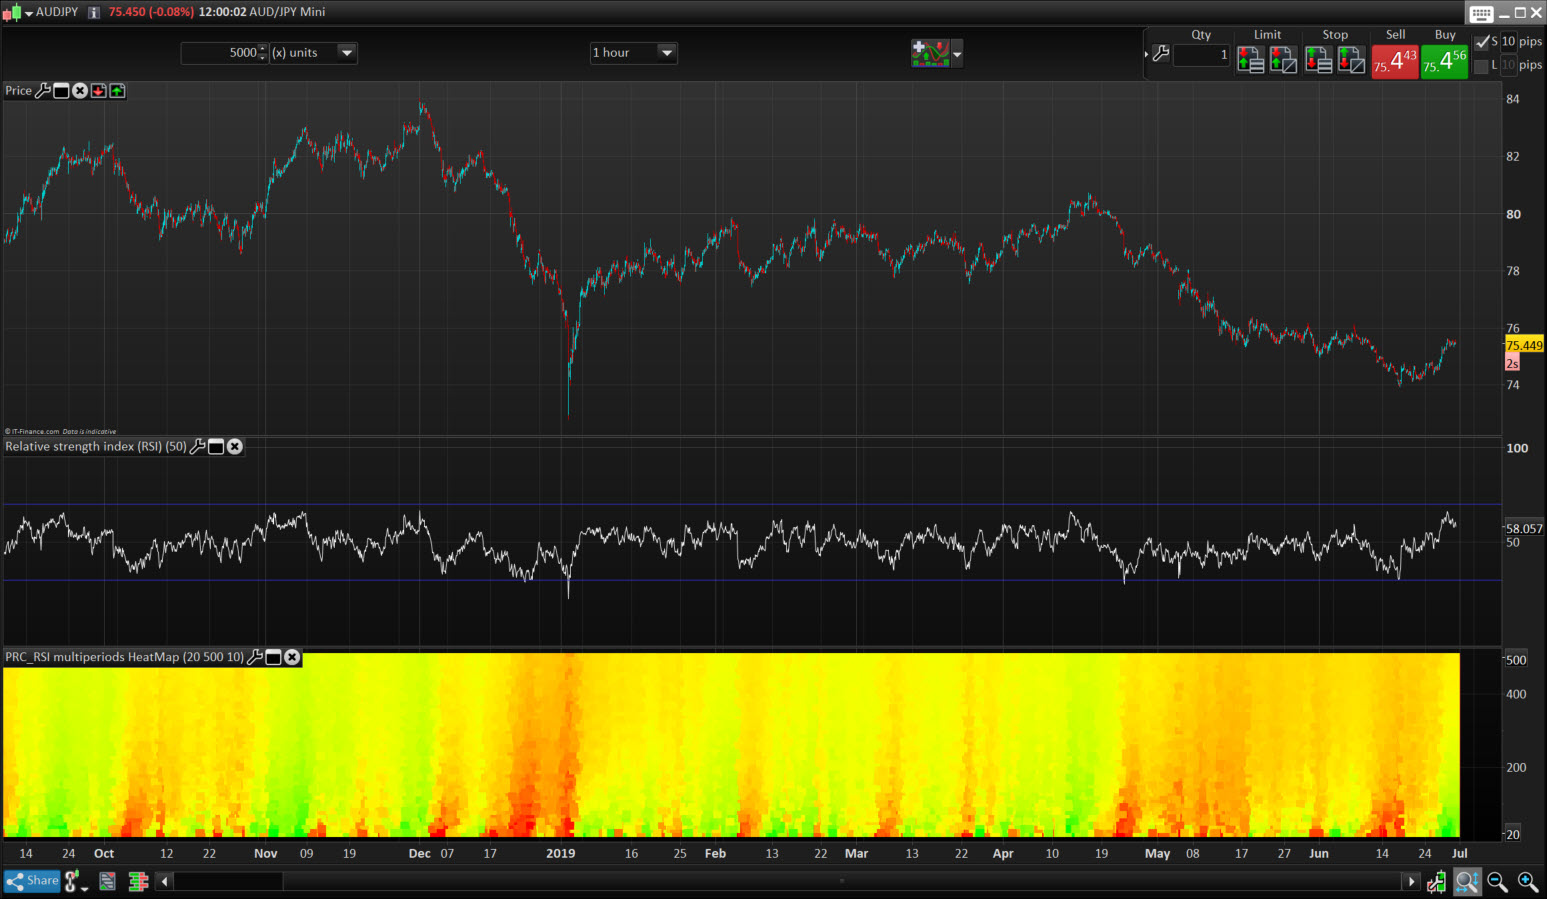
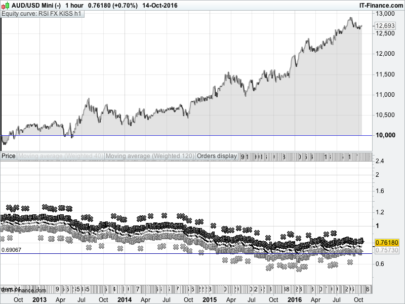
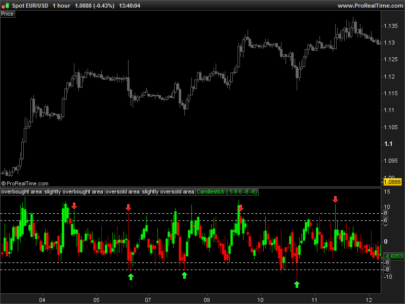
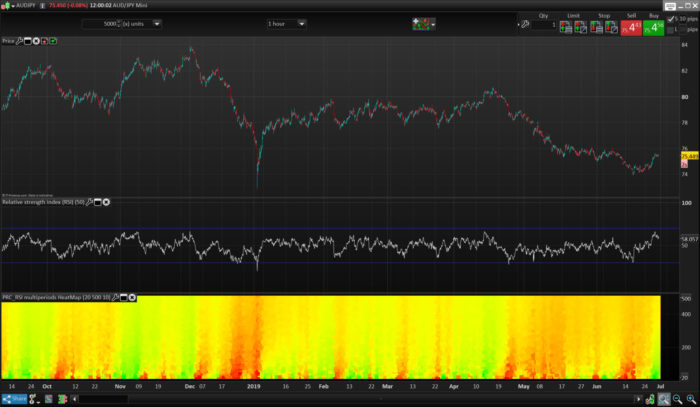
This “heatmap” type indicator plots the returned values of the RSI oscillator for all its calculated periods between the values of “StartPeriod” up to “MaxScale”. Each value is colored according to its degree of over-sold (in red) and over-bought (in green).

The ensemble thus forms a cloud of colored dots making it easy to better identify how the market behaves in the different dimensions.

It is thus possible to determine the best opportunities for positions in trend following or mean reversion without wondering what is the best period of observation with respect to the  instrument and the timeframe used. .

Many ideas can sprout from the observation of this type of indicator, I let you work 🙂

Idea came from another indicator development from that topic.


Share this

Risk disclosure:

No information on this site is investment advice or a solicitation to buy or sell any financial instrument. Past performance is not indicative of future results. Trading may expose you to risk of loss greater than your deposits and is only suitable for experienced investors who have sufficient financial means to bear such risk.

ProRealTime ITF files and other attachments : How to import ITF files into ProRealTime platform?

PRC is also on YouTube, subscribe to our channel for exclusive content and tutorials
  1. Maxime Baudin • 06/28/2019 #

    Very intresting! Thanks Nicolas

  2. Fr7 • 06/28/2019 #

    Es muy interesante….¿Podría realizar el screener que detecte los valores cuando en el heatmap está rojo o verde?

    • Nicolas • 06/28/2019 #

      Sí, pero podríamos estar limitados a los períodos debido a las limitaciones de 255 barras de ProScreener, pero ¿por qué no?

  3. Fr7 • 06/28/2019 #

    Podríamos probar el proscreener y así ayudaría a encontrar los valores que acaban de dar señal¿Cómo sería el screener Nicolas?

    • Nicolas • 06/28/2019 #

      Por favor, abra un tema en el foro para esta aplicación de filtro.

  4. ggolfet • 06/28/2019 #

    I tried to use it (with prorealtime version 11 – end of day version). I receive an error message regardind an infinite loop or too much iteractions. I tried decreasing the end period of the loop, but the error message still remains. I’m not able to find a solution, has anyone the same problem? thanks in advance

    • Nicolas • 06/28/2019 #

      Try to reduce the displayed units of the chart.
      MaxScale should always be superior to StartPeriod.

  5. ggolfet • 06/28/2019 #

    Thanks Nicolas, I imported the itf file and solved the problem.

  6. Hasardeur • 06/28/2019 #

    Hallo Nicolas,

    i tried to code the multi period heat map in combination with the Ehler’s market mode.
    https://www.prorealcode.com/prorealtime-indicators/market-mode/
    The code it self is easy to realize, but I see different results by
    – Calculation the market mode by using a single period for example 20
    – Calculation the heat map by using while loop
    Same I see by calculation other indicators.
    All are using band pass filter with look back days.
    I expect that the look back days [1] [2] [3] in combination with the while loop are causing the problem.
    It would be very helpful, if you could have a look for these problem.
    Many thanks in advance.

    Best regards
    Hasardeur

    • Nicolas • 06/28/2019 #

      Please open a new topic with the code in forum.

avatar
Register or

Likes

avatar avatar avatar avatar avatar avatar avatar avatar avatar avatar
Related users ' posts
Nicolas
8 years ago
StepRSI
StepRSI
5
Indicators
Nicolas Thanks for this modification, I still do not have tested it, where did you get this idea to ...
rfsteve Trial and error from study of indicators call it coding mad science was trying to find an in...
Maxime Baudin Nice! Thanks :)
Nicolas You'll need to preload bars to get the good calculations of you indicators. I did not test i...
David Nicolas I tried DEFPARAM Preloadbars = 5000 And still the same drawn output of entries/exit...
marcara Hi, Thank you very much for the Moving Average Daily indicator, I am using it as indicator i...
Nicolas
8 years ago
GraHal Forked code I mention above is here ... GraHal wrote: So below is the PRC Stochastic RSI v...
GraHal Try again (quite limited what you can do as Comments in the Library) https://www.prorealco...
AutoFlanders Thanks GraHal, that's what i was looking for
Nicolas Thanks for contributing to the "ichimoku section" of the prorealtime code library Don't he...
sourberry Thank you , this is a great indicator works beautifully. Could you kindly modify to scr...
pp_playaflamenca Excuse me,... reading your code about spanB: [ SenkouSpanBFutureW = (Highest[SenkouSpanPerio...
Dimi.A Awesome mate.
mora87 Hi David and Nicola, I'd like to share idea with you guys which is related to David's Idea. ...
Nicolas Please ask for custom coding in forums instead.
jeanphi0034 Hello, I would like to use the QQE indicator which is based on smooth RSI as far as I unders...
ilstefano Bonjour Nicolas, te serait il possible de rajouter la fast ATR manquante dans le code? Merci
Nicolas Désolé je ne comprends pas la question ?
rpreviteri Hi Nicolas, thanks a  loto for sharing your knowliedge, Wasn't the original momentum pinball...
air Thank you!  
elanoa Buonasera sig. Nicolas......sarebbe possibile far in modo che quando l'indicatore raggiunga ...
Mansoor What does COI stand for?
MikeGC Hi Mansoor, COI is the abbreviation for the Coppock indicator.
nonetheless Anyone interested in this strategy please see forum topic: https://www.prorealcode.com/topic...
Dimi.A Perfect for counter-trend scalping. I like this!
viktorthuns Hi Nicolas! Great work you've done with all your indicators. Just wondering about the code a...
Nicolas the value is not a boolean but an average of an addition of booleans. As stated in the descr...
zilliq The reasons why I think it's time consuming and we loose time to try to do backests and Auto...
filiprb Hello Zilliq, You don't need a system to produce a walk forward test. You can easily create...
Philip Raphael It is incredible! Thanks for sharing, Doctrading!
Yannick Thanks for sharing. This strategy is flat for 11 years and winning afterwards. Don't you thi...
Doctrading Hello, As I usually say, strategies are exposed to be improved :) So yes, I think there mu...
Lior Green Doesn't work for me. Set values “compra” and “venta” to be shown as HISTOGRAM
s00071609 Hi, could you please suggest, what this codes gives, lowest[b](rsi[a]) -- just trying to us...
Nicolas lowest[b](rsi[a]) returns the lowest values of the RSI of "a" periods, over the last "b" per...
s00071609 Hi, what would be the code to get the price for last bullish DTOSC cross over. I am looking ...
Doctrading Hello, Someone asked me something (his results seemed to be different) on my email, but it ...
Glen Marquis Not your best..So what is your best strategy? :)
cassio amigo você tem esse indicador para mt4 ou mt5.. ?
manchokcity WE NEED THIS IN MQL4 OR EX4
Nicolas We do not provide MT4 indicator in our website, all the codes around are made for Prorealti...
TradSuz C'est étrange, je note donc à nouveau les deux horaires achat et vente =9H/17H, le iRSI de l...
TradSuz Merci à Doctrading pour cette trame de code super et qui marche sur d'autres supports aussi....
Bibi83 Bonsoir à tous Juste pour vous informer que j'ai enlever les conditions short et que cela ...
Nicolas RSI is an oscillator made for price centering. This strategy bet on mean reverting phenomena...
air Good start. Works decently during stock runaway bull market. I have tested it over 80 year p...
TheHovisTrader Hi - the way Larry trades it does not work - discovered that over 10 years ago! BUT If you ...
Glen Marquis I wonder how this fairs on 5 or 15 mins. Maybe 21 or 25 instead of 14 .
Doctrading Hello, you can test it. It's not my best strategy... but I think someone can improve it.

Top