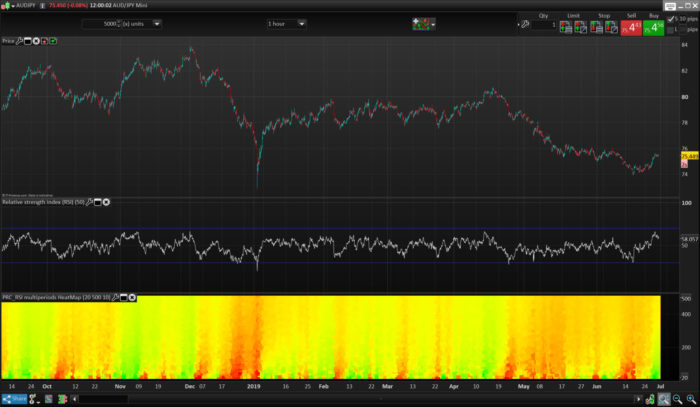
RSI MultiPeriods HeatMap

v10.3
RSI MultiPeriods HeatMap

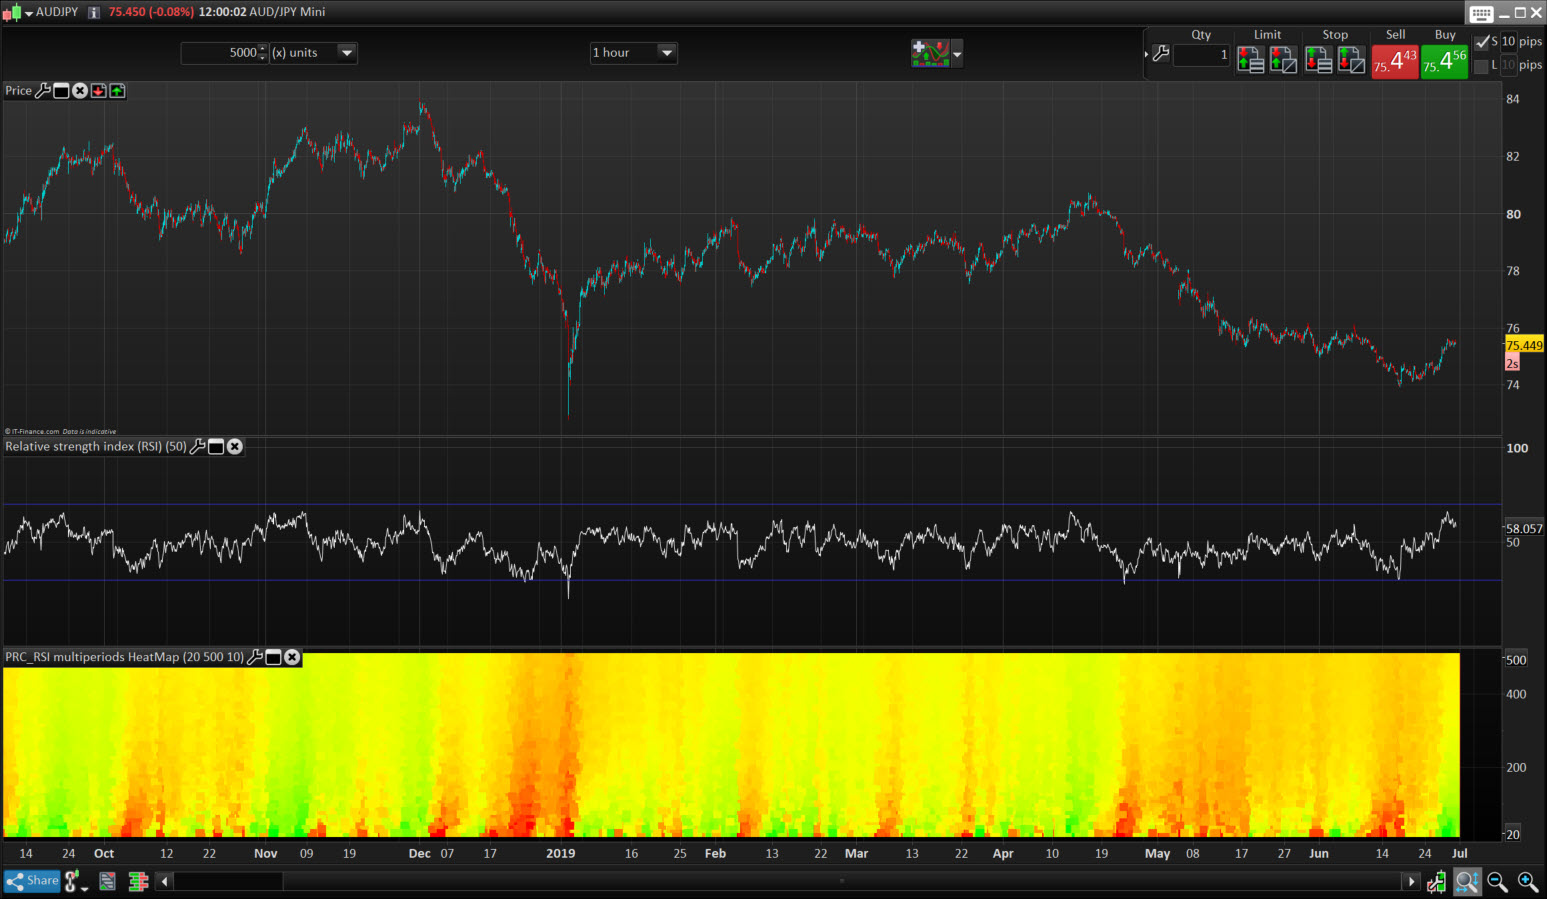
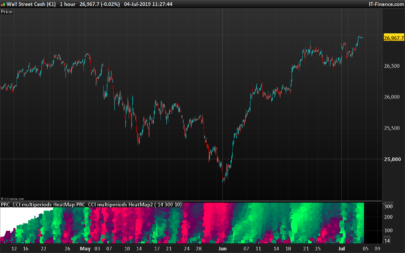
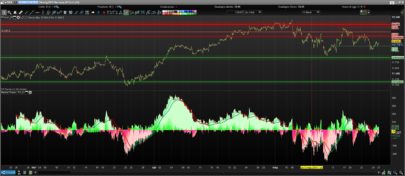
This “heatmap” type indicator plots the returned values of the RSI oscillator for all its calculated periods between the values of “StartPeriod” up to “MaxScale”. Each value is colored according to its degree of over-sold (in red) and over-bought (in green).

The ensemble thus forms a cloud of colored dots making it easy to better identify how the market behaves in the different dimensions.

It is thus possible to determine the best opportunities for positions in trend following or mean reversion without wondering what is the best period of observation with respect to the  instrument and the timeframe used. .

Many ideas can sprout from the observation of this type of indicator, I let you work 🙂

Idea came from another indicator development from that topic.


Share this

Risk disclosure:

No information on this site is investment advice or a solicitation to buy or sell any financial instrument. Past performance is not indicative of future results. Trading may expose you to risk of loss greater than your deposits and is only suitable for experienced investors who have sufficient financial means to bear such risk.

ProRealTime ITF files and other attachments : How to import ITF files into ProRealTime platform?

PRC is also on YouTube, subscribe to our channel for exclusive content and tutorials
  1. Maxime Baudin • 06/28/2019 #

    Very intresting! Thanks Nicolas

  2. Fr7 • 06/28/2019 #

    Es muy interesante….¿Podría realizar el screener que detecte los valores cuando en el heatmap está rojo o verde?

    • Nicolas • 06/28/2019 #

      Sí, pero podríamos estar limitados a los períodos debido a las limitaciones de 255 barras de ProScreener, pero ¿por qué no?

  3. Fr7 • 06/28/2019 #

    Podríamos probar el proscreener y así ayudaría a encontrar los valores que acaban de dar señal¿Cómo sería el screener Nicolas?

    • Nicolas • 06/28/2019 #

      Por favor, abra un tema en el foro para esta aplicación de filtro.

  4. ggolfet • 06/28/2019 #

    I tried to use it (with prorealtime version 11 – end of day version). I receive an error message regardind an infinite loop or too much iteractions. I tried decreasing the end period of the loop, but the error message still remains. I’m not able to find a solution, has anyone the same problem? thanks in advance

    • Nicolas • 06/28/2019 #

      Try to reduce the displayed units of the chart.
      MaxScale should always be superior to StartPeriod.

  5. ggolfet • 06/28/2019 #

    Thanks Nicolas, I imported the itf file and solved the problem.

  6. Hasardeur • 06/28/2019 #

    Hallo Nicolas,

    i tried to code the multi period heat map in combination with the Ehler’s market mode.
    https://www.prorealcode.com/prorealtime-indicators/market-mode/
    The code it self is easy to realize, but I see different results by
    – Calculation the market mode by using a single period for example 20
    – Calculation the heat map by using while loop
    Same I see by calculation other indicators.
    All are using band pass filter with look back days.
    I expect that the look back days [1] [2] [3] in combination with the while loop are causing the problem.
    It would be very helpful, if you could have a look for these problem.
    Many thanks in advance.

    Best regards
    Hasardeur

    • Nicolas • 06/28/2019 #

      Please open a new topic with the code in forum.

avatar
Register or

Likes

avatar avatar avatar avatar avatar avatar avatar avatar avatar avatar
Related users ' posts
Screw27 Salut nicolas j'aimerais savoir tes résulats grace a cettte methode
eva.g.forsgren It dose not work, I get a strap instead of candels???????????????????????????????????????????
Nicolas That indicator is the one below the chart. The indicator to put on the price chart is this o...
pyhrus P.S : IG , que j'ai contacté ,m'indique que la version V11 , ne sera pas disponible avant un...
Hasardeur Dear Nicolas, is there someting at the arry to modify in order to run the trend at the actu...
MALIMALO Dear Nicolas, just try touse your indicator with backtest but it's not working. is anybody...
ribes65 Bonjour Nicolas, Merci pour votre travail. Est-il envisageable de créer un screener pour ...
Nicolas Bien sûr, merci de formuler une demande dans le forum des screeners pour prorealtime. En res...
ipbvba Est il possible de le transformer en indicateur (pour ne plus avoir les lignes mais uniqueme...
Vinks_o_7 Vonasi you're a beast !!! ;-)))
pableitor Amazing indicator , you are pushing PRT to the limit! But looking at the scatter its not c...
Vinks_o_7 Thanks Doc !
Maxime Baudin Intresting, thank you!
Zigo
5 years ago
fifi743 Good morning, there is no mistake about the shorts c11=SMI[14,3,5](close)>-40
Zigo has to be c11=SMI[14,3,5] < -40 (indeed)
xar3 Thank you ;-) Zigo
Sapo Thank you very much. as always your indicators are extremely effective. kind regards Vonasi.
mitsu21 Hi, it looks nice. I'll try it tomorrow thank you for your share kind regards bruno
kj1988 Thank you Vonasi for sharing this indicator. Very useful as a comfirmation to the price act...
Byggtrader Hi Nicolas! How do I get the indicator in the price chart? It only stays under i new chart.
Nicolas Just add it on the price chart by using the wrench on the left upper side of the chart (pric...
Dom Hello, hello....je commence le trading et découvre par la même occasion le codage....et ce n...
Nicolas Merci, ça fait plaisir !
Be-n Bonjour tout le monde ! Dans l'indicateur de tendance, j'ai du mal à saisir la nuance entre ...
manchokcity can we have it in mql4 platform? or how or which platform do we use it?
camporan I don't use MetaTrader so I won't be able to do the translation myself. Sorry!
Alexander9 This can for amibroker ? . Thanks
Teddy Coronak Bonjour Nicolas , je voulais simplement te dire merci pour cet indicateur. Très simple et...
€Ȝ Hi Nicolas, Excellent piece of code. I used your concept in one of my own indicators too wh...
Nicolas Thanks a lot for the tip.
Marie-Eve Vergoz lorsque je copie les codes, le système me signale des erreurs à la ligne 12 et suivantes
Marie-Eve Vergoz sorry - tout est ok -
AlgoAlex
6 years ago
Marcot18 Alex ti sei superato
AlexF Esagerato!
jobswaps Sube como trazar lineas de tendencias a tantas barras
Frankiesc interesting indicator !! Thanks for sharing!!!
robertogozzi Thank you :)
winnie37 yes. "No ground breaking math here, but I am finding very useful and some algo based on it i...
Jan Wind Also interesting to know what does not work, which set up you use, saves me investigating ! ...
winnie37 i just set the proorder like this: buy when 50/100/200 phase >0 and sell when under 0, go...
Vinks_o_7
6 years ago
IV Mcm I've always wondered how to make the ADX faster, thank you!
Vinks_o_7 You welcome !
Vinks_o_7 Another variation that may be more accurate : we calculate the average of normalized DI's in...
nfulcher Please could someone explain how the following code is calculated:- iDI = TEMA[3](DI[DI2]...
oakenstream Jan, I find sometimes that the priceexit variable is never set. It seems to happen when the ...
Matt66612 I do not understand the first time I launch the backtest I got the same result as you. but ...
JJ Tec Hola Las condiciones de entrada / salida vienen en el libro de J. Carter Mastering the trad...
Pixeldd Ich bekomme beim einfügen des Indikators einen Fehler angezeigt. Was bitte muss ich genau än...
HarryPro Hello, Firtly there appears to be a typo on line 6 "lenghkc=20" should this be "lengthkc=...
sir_i Bonjour à tous, Je suis nouveau sur le forum et sur la plateforme, pourriez-vous me dire com...
Nicolas Il faut simplement l'appliquer sur le prix.
sir_i Merci pour la réponse, je ne suis pas familier avec l'application de cette procédure simple,...

Top