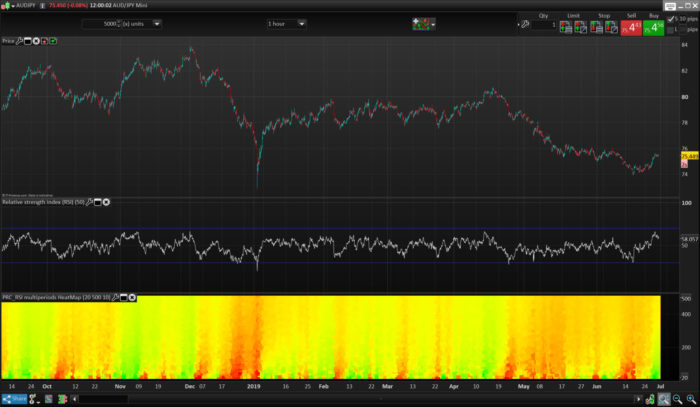
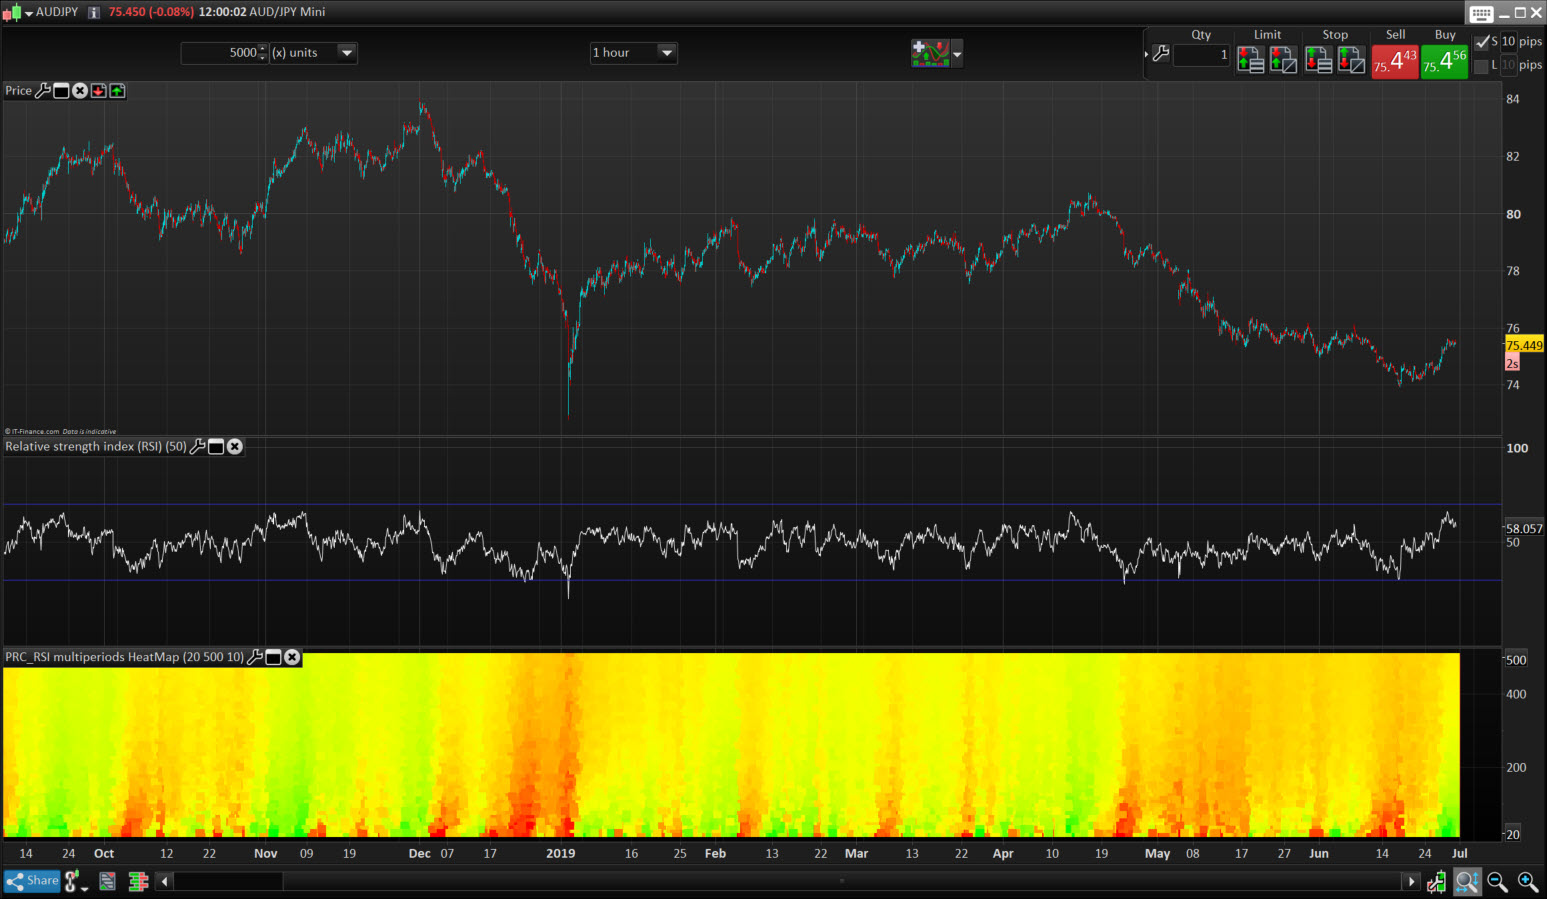
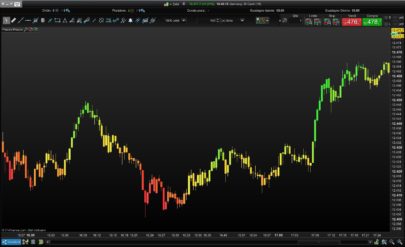
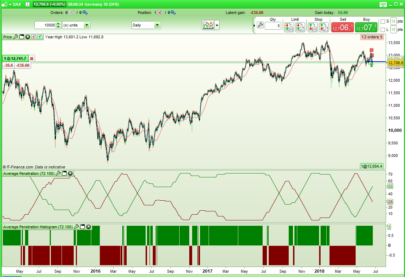
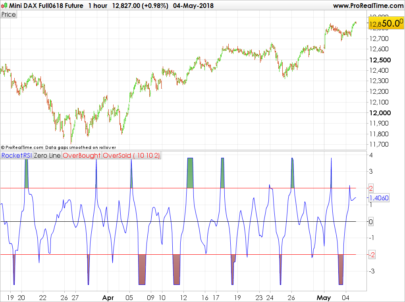
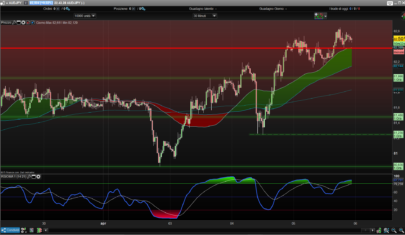
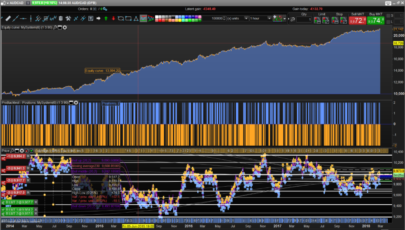
This “heatmap” type indicator plots the returned values of the RSI oscillator for all its calculated periods between the values of “StartPeriod” up to “MaxScale”. Each value is colored according to its degree of over-sold (in red) and over-bought (in green).
The ensemble thus forms a cloud of colored dots making it easy to better identify how the market behaves in the different dimensions.
It is thus possible to determine the best opportunities for positions in trend following or mean reversion without wondering what is the best period of observation with respect to the instrument and the timeframe used. .
Many ideas can sprout from the observation of this type of indicator, I let you work 🙂
Idea came from another indicator development from that topic.
|
1 2 3 4 5 6 7 8 9 10 11 12 13 14 15 16 17 18 19 20 21 22 23 24 25 26 27 28 29 30 31 |
//PRC_RSI multiperiods HeatMap | indicator //Plot an heatmap of the RSI range of periods //28.06.2019 //Nicolas @ www.prorealcode.com //Sharing ProRealTime knowledge // --- settings startperiod=20 //start period of the loop maxscale=500 //end period of the loop Step=10 //period step of the loop // --- end of settings iPeriod=startperiod //first period to test is..startperiod while iPeriod<=maxscale do // --- indicator calculation osc = rsi[iperiod] // ----- result=osc R = max(0,50+(200-(result-50)*12)) G = max(0,50+(200+(result-50)*12)) drawtext("■",barindex,iperiod,dialog,bold,18) coloured(min(r,255),min(g,255),0) iPeriod=max(startperiod,iPeriod+Step) //increase indicator period for next loop iteration wend return startperiod,maxscale |
Share this
No information on this site is investment advice or a solicitation to buy or sell any financial instrument. Past performance is not indicative of future results. Trading may expose you to risk of loss greater than your deposits and is only suitable for experienced investors who have sufficient financial means to bear such risk.
ProRealTime ITF files and other attachments :PRC is also on YouTube, subscribe to our channel for exclusive content and tutorials



Very intresting! Thanks Nicolas
Es muy interesante….¿Podría realizar el screener que detecte los valores cuando en el heatmap está rojo o verde?
Sí, pero podríamos estar limitados a los períodos debido a las limitaciones de 255 barras de ProScreener, pero ¿por qué no?
Podríamos probar el proscreener y así ayudaría a encontrar los valores que acaban de dar señal¿Cómo sería el screener Nicolas?
Por favor, abra un tema en el foro para esta aplicación de filtro.
I tried to use it (with prorealtime version 11 – end of day version). I receive an error message regardind an infinite loop or too much iteractions. I tried decreasing the end period of the loop, but the error message still remains. I’m not able to find a solution, has anyone the same problem? thanks in advance
Try to reduce the displayed units of the chart.
MaxScale should always be superior to StartPeriod.
Thanks Nicolas, I imported the itf file and solved the problem.
Hallo Nicolas,
i tried to code the multi period heat map in combination with the Ehler’s market mode.
https://www.prorealcode.com/prorealtime-indicators/market-mode/
The code it self is easy to realize, but I see different results by
– Calculation the market mode by using a single period for example 20
– Calculation the heat map by using while loop
Same I see by calculation other indicators.
All are using band pass filter with look back days.
I expect that the look back days [1] [2] [3] in combination with the while loop are causing the problem.
It would be very helpful, if you could have a look for these problem.
Many thanks in advance.
Best regards
Hasardeur
Please open a new topic with the code in forum.