RSI MultiPeriods HeatMap

v10.3
RSI MultiPeriods HeatMap

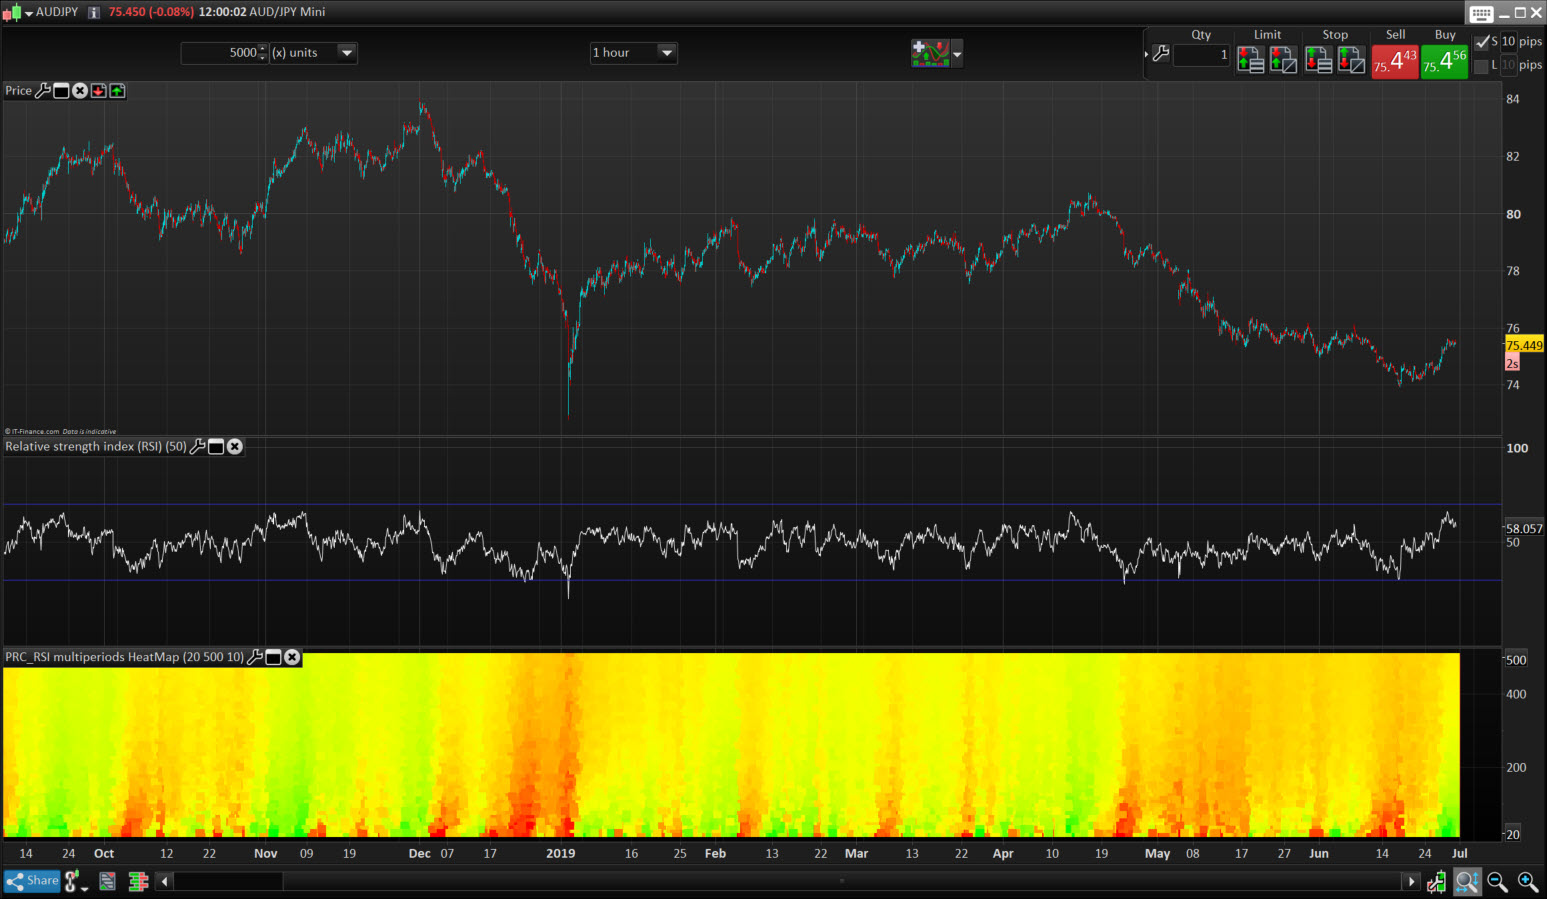
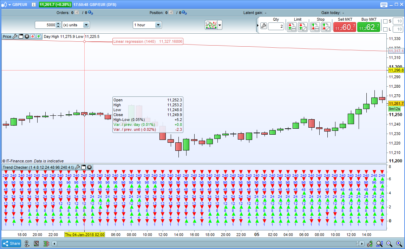
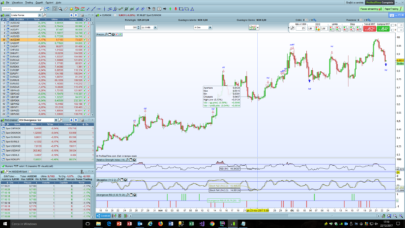
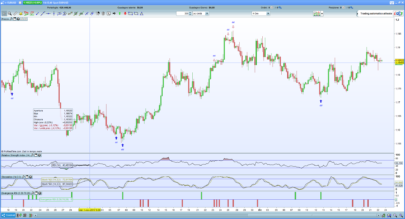
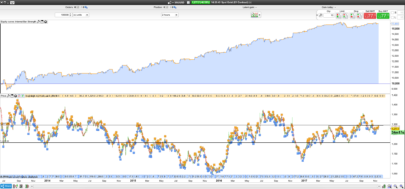
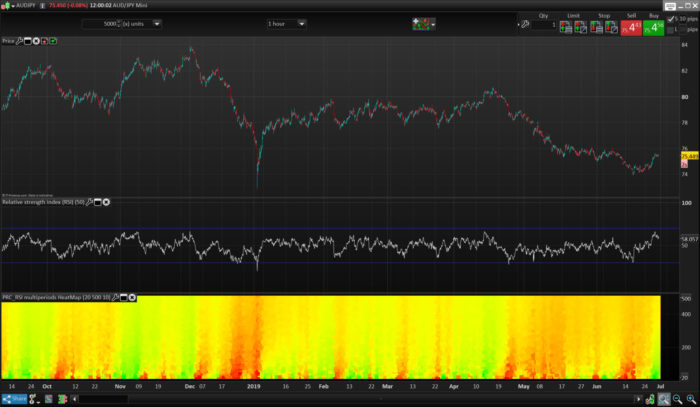
This “heatmap” type indicator plots the returned values of the RSI oscillator for all its calculated periods between the values of “StartPeriod” up to “MaxScale”. Each value is colored according to its degree of over-sold (in red) and over-bought (in green).

The ensemble thus forms a cloud of colored dots making it easy to better identify how the market behaves in the different dimensions.

It is thus possible to determine the best opportunities for positions in trend following or mean reversion without wondering what is the best period of observation with respect to the  instrument and the timeframe used. .

Many ideas can sprout from the observation of this type of indicator, I let you work 🙂

Idea came from another indicator development from that topic.


Share this

Risk disclosure:

No information on this site is investment advice or a solicitation to buy or sell any financial instrument. Past performance is not indicative of future results. Trading may expose you to risk of loss greater than your deposits and is only suitable for experienced investors who have sufficient financial means to bear such risk.

ProRealTime ITF files and other attachments : How to import ITF files into ProRealTime platform?

PRC is also on YouTube, subscribe to our channel for exclusive content and tutorials
  1. Maxime Baudin • 06/28/2019 #

    Very intresting! Thanks Nicolas

  2. Fr7 • 06/28/2019 #

    Es muy interesante….¿Podría realizar el screener que detecte los valores cuando en el heatmap está rojo o verde?

    • Nicolas • 06/28/2019 #

      Sí, pero podríamos estar limitados a los períodos debido a las limitaciones de 255 barras de ProScreener, pero ¿por qué no?

  3. Fr7 • 06/28/2019 #

    Podríamos probar el proscreener y así ayudaría a encontrar los valores que acaban de dar señal¿Cómo sería el screener Nicolas?

    • Nicolas • 06/28/2019 #

      Por favor, abra un tema en el foro para esta aplicación de filtro.

  4. ggolfet • 06/28/2019 #

    I tried to use it (with prorealtime version 11 – end of day version). I receive an error message regardind an infinite loop or too much iteractions. I tried decreasing the end period of the loop, but the error message still remains. I’m not able to find a solution, has anyone the same problem? thanks in advance

    • Nicolas • 06/28/2019 #

      Try to reduce the displayed units of the chart.
      MaxScale should always be superior to StartPeriod.

  5. ggolfet • 06/28/2019 #

    Thanks Nicolas, I imported the itf file and solved the problem.

  6. Hasardeur • 06/28/2019 #

    Hallo Nicolas,

    i tried to code the multi period heat map in combination with the Ehler’s market mode.
    https://www.prorealcode.com/prorealtime-indicators/market-mode/
    The code it self is easy to realize, but I see different results by
    – Calculation the market mode by using a single period for example 20
    – Calculation the heat map by using while loop
    Same I see by calculation other indicators.
    All are using band pass filter with look back days.
    I expect that the look back days [1] [2] [3] in combination with the while loop are causing the problem.
    It would be very helpful, if you could have a look for these problem.
    Many thanks in advance.

    Best regards
    Hasardeur

    • Nicolas • 06/28/2019 #

      Please open a new topic with the code in forum.

avatar
Register or

Likes

avatar avatar avatar avatar avatar avatar avatar avatar avatar avatar
Related users ' posts
Matriciel
7 years ago
Alai-n Thanks...
Bard Thanks for sharing this Verdi55. More instructions from Larry Williams website (and a fea...
Actabi Thank you ! Have you realised your "next step" ?
Jessar guten Tag, gibt es bereits die Aktualisierte Datei?
Per Inge Gents - An update - I have been studying various trading approaches, as this one that is bas...
Nicolas
7 years ago
Jurik RSX
v10.3
Jurik RSX
3
Indicators
hartgeld Hallo Nicolas, ein sehr guter Indikator, vielen Dank! Leider rechnet er bei mir nicht die Pe...
rigel Hi Nicolas, have you coded the Jurik alone (as Mov. average)?
Nicolas 2 versions available in this indicator: https://www.prorealcode.com/prorealtime-indicators/a...
juanj This gets me thinking about creating a strategy on the 5min timeframe that only takes trades...
GraHal I noted above does okay on DAX 10 min with even a reduction to 30 of the Stop Loss. I've s...
Kris75 Hi Grahal, What about making the same great work you did with the snipet on google doc but...
AG1 Thanks Nicolas Still a problem in line 29 Please take a look. thanks again Alex
Nicolas code is modified in the above post, use that one.
AG1 Still a problem in line 29 Please take a look. thanks again Alex
Gianluca thank you very nice screener
styrke Hello Nicolas, Nice screener, I appreciate the way you always try to condense at maximum th...
Nicolas There's no particular reason. RSI is widely use with its default period and results seems re...
Vonasi I noticed a couple of typo errors in the code. The list of variables lines 4 to 11 should be...
Genotik Thank you for your important contribution this week which is much appreciated! Happy New Yea...
Vonasi No problem. I hope they are useful to someone. Happy and hopefully prosperous New Year to y...
DarioMazza Hi Vonasi, i have a question for you, the comand "pricetype" where did you found it in the ...
Vonasi PriceType is just a variable that I use. The value decides what type of price is used in the...
Vonasi I noticed a couple of typo errors in the code. The list of variables lines 4 to 11 should be...
MaoRai54 Hi, first of all Happy New Year. Well, I've inserted your indicator in DAX 1h but I cann...
Vinks_o_7 Hi Mao Happy New Year ! This is just an improved RSI where you plot a standard price momen...
Angel Perez Ciao Francesco. First of all thanks for the indicator and also fro the screener. I do have a...
PSIDIO Ciao to you all, I also have a question and would be very happy for a helpful comment. I a...
SpreadBetMH Hi there, I have V11.1. I get the Indicator but no Arrows on the price. Kind Regards...
Alai-n Ciao Francesco, sei ancora in giro?
Metodi97 This indicator is great but can someone create strategy based on the same indicator it will ...
Nicolas
7 years ago
TradeNavigator RSI
TradeNavigator RSI
10
Indicators
Nicolas Tutte le impostazioni che hanno la parola "period" sono quelle dedicate ai periodi di cambio...
GianfrancoCeck Le chiedo una ultima cosa, ossia se è possibile personalizzare l'indicatore con una scritta ...
Nicolas Spiacente che non sia possibile, le coordinate grafiche non sono in pixel ma nel prezzo e ne...
Madrosat Bonjour Nicolas la formule du stop loss est elle vraiment valable ?? il n'y a pas au depart ...
Nicolas Il y a peut-être un erreur en effet, essayer avec: set stop ploss (averagetruerange[14] * ...
Madrosat ok merci Nicolas c'est avec /pipsize que ça fonctionne
bazilou pouvez expliquer donchian bias merci
Nicolas Your picture is too small, but for sure the problem is about the fact you are still using v1...
Rory Dryden Thanks. This looks useful.
Edelmiro Un millón... de gracias... me gustaría más, poder ofrecer euros; pero va a ser que no puedo,...
Jessar Hello, could you tell me how to use this indicator? I think the simplest things can still be...
WarningTrading Comment peut on la comparer ? comme ceci ? cela ne me donne plus le message d'erreur manque...
sally31120 Bonjour, je n'arrive pas à créer ce screener close > supertrend extended2[1] la réponse...
Nicolas voir ce sujet pour un screener basé sur Supertrend Extended: https://www.prorealcode.com/top...

Top