RSI MultiPeriods HeatMap

v10.3
RSI MultiPeriods HeatMap

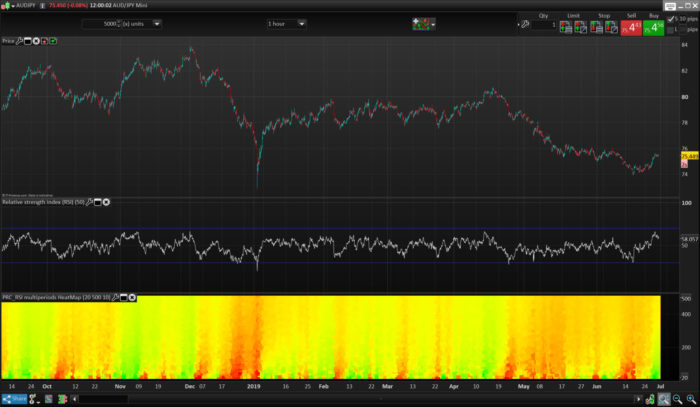
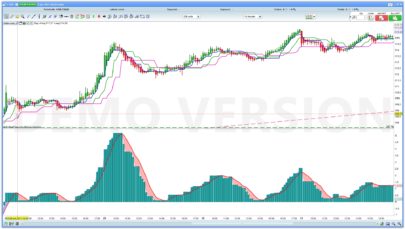
This “heatmap” type indicator plots the returned values of the RSI oscillator for all its calculated periods between the values of “StartPeriod” up to “MaxScale”. Each value is colored according to its degree of over-sold (in red) and over-bought (in green).

The ensemble thus forms a cloud of colored dots making it easy to better identify how the market behaves in the different dimensions.

It is thus possible to determine the best opportunities for positions in trend following or mean reversion without wondering what is the best period of observation with respect to the  instrument and the timeframe used. .

Many ideas can sprout from the observation of this type of indicator, I let you work 🙂

Idea came from another indicator development from that topic.


Share this

Risk disclosure:

No information on this site is investment advice or a solicitation to buy or sell any financial instrument. Past performance is not indicative of future results. Trading may expose you to risk of loss greater than your deposits and is only suitable for experienced investors who have sufficient financial means to bear such risk.

ProRealTime ITF files and other attachments : How to import ITF files into ProRealTime platform?

PRC is also on YouTube, subscribe to our channel for exclusive content and tutorials

  1. Maxime Baudin • 06/28/2019 #

    Very intresting! Thanks Nicolas

  2. Fr7 • 06/28/2019 #

    Es muy interesante….¿Podría realizar el screener que detecte los valores cuando en el heatmap está rojo o verde?

    • Nicolas • 06/28/2019 #

      Sí, pero podríamos estar limitados a los períodos debido a las limitaciones de 255 barras de ProScreener, pero ¿por qué no?

  3. Fr7 • 06/28/2019 #

    Podríamos probar el proscreener y así ayudaría a encontrar los valores que acaban de dar señal¿Cómo sería el screener Nicolas?

    • Nicolas • 06/28/2019 #

      Por favor, abra un tema en el foro para esta aplicación de filtro.

  4. ggolfet • 06/28/2019 #

    I tried to use it (with prorealtime version 11 – end of day version). I receive an error message regardind an infinite loop or too much iteractions. I tried decreasing the end period of the loop, but the error message still remains. I’m not able to find a solution, has anyone the same problem? thanks in advance

    • Nicolas • 06/28/2019 #

      Try to reduce the displayed units of the chart.
      MaxScale should always be superior to StartPeriod.

  5. ggolfet • 06/28/2019 #

    Thanks Nicolas, I imported the itf file and solved the problem.

  6. Hasardeur • 06/28/2019 #

    Hallo Nicolas,

    i tried to code the multi period heat map in combination with the Ehler’s market mode.
    https://www.prorealcode.com/prorealtime-indicators/market-mode/
    The code it self is easy to realize, but I see different results by
    – Calculation the market mode by using a single period for example 20
    – Calculation the heat map by using while loop
    Same I see by calculation other indicators.
    All are using band pass filter with look back days.
    I expect that the look back days [1] [2] [3] in combination with the while loop are causing the problem.
    It would be very helpful, if you could have a look for these problem.
    Many thanks in advance.

    Best regards
    Hasardeur

    • Nicolas • 06/28/2019 #

      Please open a new topic with the code in forum.

avatar
Register or

Likes

avatar avatar avatar avatar avatar avatar avatar avatar avatar avatar
Related users ' posts
diegofe_2000 cordial saludo NICOLAS , gracias por excelente indicador. ¿ es posible obtenerlo en MT4 ? ...
Nicolas Lo siento, pero no estoy trabajando para ayudar a la gente aquí de forma gratuita para promo...
diegofe_2000 Nicolas , gracias por tu atención. La pregunta era por curiosidad (yo no trabajo ni manejo ...
David Balance thanks for sharing this excellent indicator.  Here are some thoughts.  please ad...
ALE
8 years ago
CSR strategy DAX 1 D
17
Strategies
Jesper I tried it on dax 1D and I did not get any trades. Shifted to 10H and it started working. Wo...
rgrgrgr I have the same problem
avatar
crazytrader Is this working?
Maz
8 years ago
Francesco78 very nice, thanks!
Wilko Interesting! Thanks for sharing!
BjornH Extremely nice, thanks!
finplus Thanks for the job. Which variables do you suggest for timeframe 1 hour? 
Maz Depends massively on your market and the volatility. I suggest using the variable optimizer ...
1Randy This a great momentum filter! I would like to see volume momentum incorporated into the indi...
larmhen
8 years ago
HerveS_67 Bonjour, A quoi correspondent les données S, M, L ? Hello, What do the data S, M, L?
Vinks_o_7 aux paramètres à rentrer : 5 20 et 200...
imokdesign Hi Everybody, when I look at the strategy I felt the need to implement a Moneymanagement-Sy...
Inertia newlevel then multiplier=multiplier+1 oldlevel=newlevel newlevel=strategyprofit+startequi...
Inertia Hi Bjoern, I was playing around with your code this morning (EUR/USD 5'). Thank you to the...
Maxime Baudin Nice, thanks!
rowestock Hi Nicolas, I am revisiting this indicator and wanted to ask, is it possible to replace sty...
Nicolas Why not, please add a new request in our probuilder forums.
majid52026 Hi I want MBXF Timing for mq5 Does anyone have this indicator???
dertopen Hi Nicolas good work for the code translation when i chek the mbfx system site i see in t...
Nicolas Yes, just change the color by yourself in the indicator settings window.
JanWd Thank you for the coding, it seems promising. FTSE gives for the short term (5 min) promis...
Jan Wind 21.04.2019: I retested the strategy for the DAX 5 minutes , it works fine for 10.000 bars, b...
bertrandpinoy hello Francesco, are you still working on this strategy?
Nicolas All conditions under parenthesis for the c1 to c4 conditions should be inverted. 
tomus Can you give an example of the overbought codes please? Thanks.
ams123 Frank Merci Nicholas -:)
Djo Not working on V11. The RSI doesn't appear on the chart.
Mika83 Bonjour, J'ai des soucis de lecture de syntaxe avec la variable "drawsegment" sur la versio...
seb234 Salut Mika, j'ai la version V11.1, la formule fonctionne. Mais il est préférable, dixit Nico...
bolsatonimora2 Hi, nice indicator, it´s possible to include a middle line with 50 value? ty!
gabri Hi, EMA26 approximate almost exactly the 50% line
Alain Wilder MA is exactly the 50% line
supertiti Thanks you so much Lucassen
dreif123 hi, copied the above code, not working on 10.3 the system says "return can only be used at ...
LUCASSEN Hallo , i have no problem , and i have the same versie 10.3, maybe you can ask Nicolas, tha...
owes29 Hi is there anyway to develop this for the pro scanner on daily or hourly scans. so it woul...
Nicolas Of course, please add a query in the proscreener forum.
Bruno Carnazzi C'est dommage, cette histoire d'énergie fractale bousille complètement la précision de l'ind...
gregus bonjour a tous quelqu un pourait il recodé en prt il sagit  du dynamique zone ma, je n arri...
Nicolas Merci de faire une requête spécifique sur le forum. 
verdi55 Is there such a thing as a free lunch ?
maceng Thanks Nicolas for this great work! I would like to understand the math behind it in order t...
Nicolas Sorry I have no time to provide assistance for python programmers. Have a good day.
Maz Hi all, firstly happy to know that this is helping you. I look into updating it for PRT11 wh...
Nicolas just use 3 times a linear regression channel code you will find in the library.
leederbyshire Here's the link to alternative linear regression channel indicator Nicolas is referring to t...

Top