
1. Introduction
The Relative Strength Index (RSI) is a highly popular technical indicator that measures the magnitude of recent price changes to evaluate overbought or oversold conditions in a market. On the other hand, the Supertrend is a trend indicator that uses the Average True Range (ATR) to determine the direction of the trend and provide buy or sell signals.
The ‘RSI Supertrend’ combines these two powerful indicators into one, offering a robust tool for identifying trends and reversal points in the market.
2. Indicator Functionality
RSI Calculation
The RSI is calculated using the following formula:
RSI = 100 – 100 / (1 + RS)
Where RS is the average of gains in bullish periods divided by the average of losses in bearish periods. In this case, we use a 14-period RSI:
|
1 |
myrsi = rsi[relativeStrengthIndexLength](rsiInputSource) |
The calculated RSI is smoothed using a 14-period moving average:
|
1 |
rsiMovingAverage = average[movingAverageLength, movingAverageType](myrsi) |
Supertrend Calculation Based on RSI
The Supertrend is calculated using the ATR to determine market volatility. The process includes the following steps:
1. True Range (TR) Calculation:
|
1 2 |
highestHigh = highest[averageTrueRangeLength](pricesource) lowestlow = lowest[averageTrueRangeLength](pricesource) |
2. Average True Range (ATR) Calculation:
|
1 |
atr = average[averageTrueRangeLength](truerange) |
3. Determination of Supertrend Levels (UP and DN):
|
1 2 |
up = pricesource - trendFactor * atr dn = pricesource + trendFactor * atr |
4. Determination of the Trend:
|
1 2 3 4 5 |
if trend = 1 then mysupertrend = up else mysupertrend = dn endif |
3. Configuring the Indicator in ProRealTime
The ‘RSI Supertrend’ can be customized using various configurable parameters:
– relativeStrengthIndexLength: RSI period length (default, 14).
– rsiInputSource: Data source for RSI calculation.
– movingAverageLength: Length of the moving average used to smooth the RSI.
– movingAverageType: Type of moving average (7 represents a simple moving average).
– trendFactor: Trend factor used to calculate Supertrend levels.
– averageTrueRangeLength: Period length for ATR calculation.
– obline, osline, midline: Overbought, oversold, and middle lines.
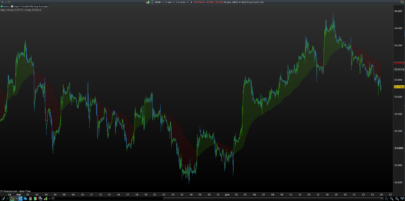
4. Practical Application
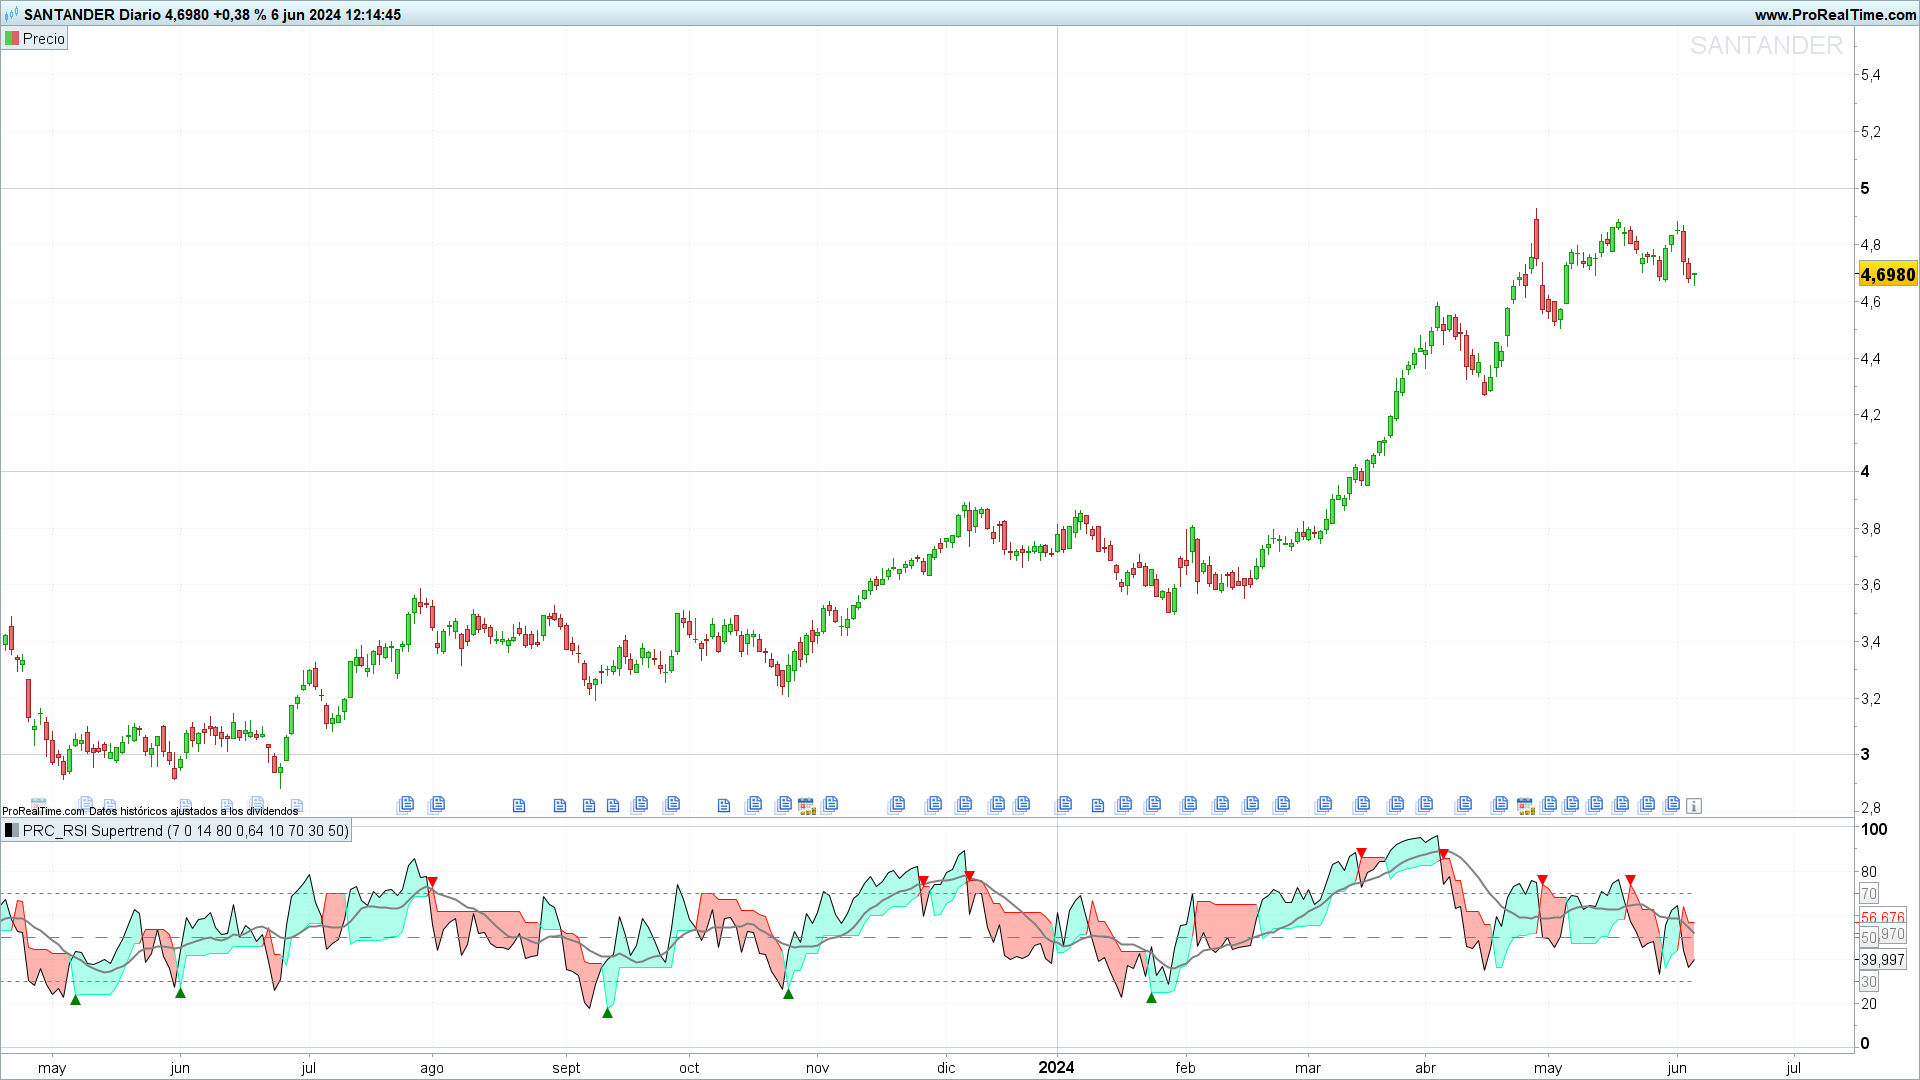
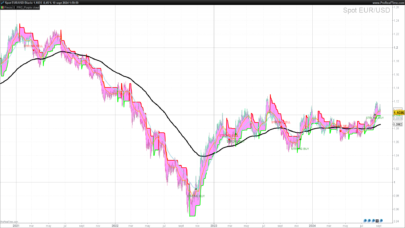
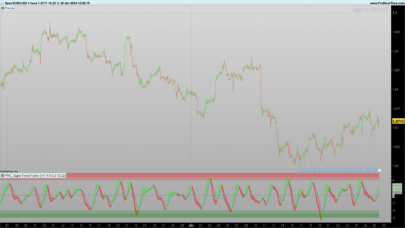
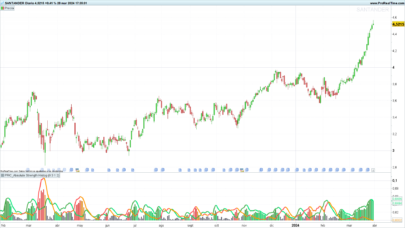
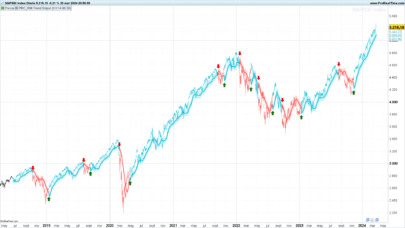
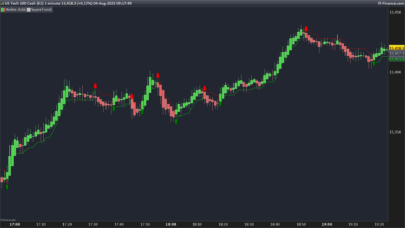
The ‘RSI Supertrend’ provides clear visual signals for buy and sell operations:
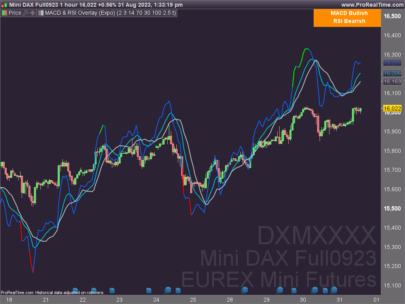
– Buy Signal: When the RSI crosses the Supertrend upwards and the RSI is greater than the overbought line (obline).
– Sell Signal: When the RSI crosses the Supertrend downwards and the RSI is less than the oversold line (osline).
These crosses indicate possible trend reversal points, offering opportunities to enter and exit the market.
Advantages:
– Combines the strength of the RSI and Supertrend.
– Provides buy and sell signals based on trend and momentum.
Limitations:
– May generate false signals in sideways markets.
– Requires parameter adjustments for different assets and market conditions.
5. ProRealTime Indicator Code
|
1 2 3 4 5 6 7 8 9 10 11 12 13 14 15 16 17 18 19 20 21 22 23 24 25 26 27 28 29 30 31 32 33 34 35 36 37 38 39 40 41 42 43 44 45 46 47 48 49 50 51 52 53 54 55 56 57 58 59 60 61 62 63 64 65 66 67 68 69 70 71 72 73 74 75 76 77 78 79 80 81 82 83 84 85 86 87 88 89 90 91 92 93 94 95 96 97 98 |
//--------------------------------------------------------------------// //PRC_RSI Supertrend //version = 1 //03.06.24 //Iván González @ www.prorealcode.com //Sharing ProRealTime knowledge //--------------------------------------------------------------------// //-----Inputs---------------------------------------------------------// relativeStrengthIndexLength=14 rsiInputSource = customclose movingAverageLength=14 movingAverageType=7 trendFactor=0.8 averageTrueRangeLength=10 obline=70 osline=30 midline=50 transparency=80 //--------------------------------------------------------------------// //-----RSI Calculation------------------------------------------------// myrsi=rsi[relativeStrengthIndexLength](rsiInputSource) rsiMovingAverage=average[movingAverageLength,movingAverageType](myrsi) //--------------------------------------------------------------------// //-----Calculating Supertrend based on RSI values---------------------// pricesource=myrsi highestHigh=highest[averageTrueRangeLength](pricesource) lowestlow=lowest[averageTrueRangeLength](pricesource) if barindex <= averageTrueRangeLength then truerange=highestHigh-lowestlow else truerange=max(highestHigh-lowestlow,max(abs(highestHigh-pricesource[1]),abs(lowestlow-pricesource[1]))) endif alpha = 1/averageTrueRangeLength if barindex <= 4*averageTrueRangeLength then atr = average[averageTrueRangeLength](truerange) else atr = alpha*truerange + (1-alpha)*atr[1] endif up = pricesource - trendFactor*atr up1 = up[1] if pricesource[1] > up1 then up = max(up,up1) else up = up endif dn = pricesource + trendFactor*atr dn1 = dn[1] if pricesource[1] < dn1 then dn = min(dn,dn1) else dn = dn endif once trend = 1 if trend = -1 and pricesource > dn1 then trend = 1 elsif trend = 1 and pricesource < up1 then trend = -1 else trend = trend endif if trend = 1 then mysupertrend = up else mysupertrend = dn endif //--------------------------------------------------------------------// if trend=1 then r=0 g=255 b=187 else r=255 g=17 b=0 endif //--------------------------------------------------------------------// colorbetween(mysupertrend,pricesource,r,g,b,transparency) //--------------------------------------------------------------------// if mysupertrend crosses over pricesource and mysupertrend>Obline then drawtext("▼",barindex,mysupertrend+2)coloured("red") elsif mysupertrend crosses under pricesource and mysupertrend<osline then drawtext("▲",barindex,mysupertrend-2)coloured("green") endif //--------------------------------------------------------------------// return pricesource as "RSI",mysupertrend as "Supertrend"coloured(r,g,b),rsiMovingAverage as "MA RSI" coloured("grey")style(line,2),obline as "Overbought Line" coloured("grey")style(dottedline),osline as "Overbought Line" coloured("grey")style(dottedline),midline as "Middle Line" coloured("grey")style(dottedline2) |
6. Conclusion
The ‘RSI Supertrend’ is a valuable tool for traders looking to identify trends and reversal points in the market. By combining the RSI with the Supertrend, a more comprehensive view of market momentum and direction is obtained, which can help make more informed trading decisions.
Share this
No information on this site is investment advice or a solicitation to buy or sell any financial instrument. Past performance is not indicative of future results. Trading may expose you to risk of loss greater than your deposits and is only suitable for experienced investors who have sufficient financial means to bear such risk.
ProRealTime ITF files and other attachments :
Find other exclusive trading pro-tools on ![]()
PRC is also on YouTube, subscribe to our channel for exclusive content and tutorials


ChatGPT
Hola Iván. Gracias por tu excelente trabajo.
Te agradecería si pudieras echarle un vistazo a mi solicitud.
https://www.prorealcode.com/topic/conversion-de-indicator-code/
ok, perfecto! me pongo con ello