Introduction
The RSI Swing Indicator is an advanced analytical tool that utilizes the popular and one of my favorite indicators, the Relative Strength Index (RSI), to offer a more dynamic and versatile way to identify overbought and oversold conditions in the market. This indicator stands out for its ability to adapt to different market conditions and its utility across multiple time frames, making it a valuable choice for both intraday traders and those who prefer longer-term operations.
The RSI Swing Indicator goes beyond simply measuring price dynamics, allowing users to set personalized overbought and oversold thresholds, and offering a clear visualization of price channels and pivot points that are critical for trading decision-making. Its intuitive design and the implementation of visual signals make it easier to identify optimal moments to enter or exit the market, thus improving trading strategies based on technical indicators.
With its focus on customization and adaptability, the RSI Swing Indicator presents itself as an essential tool for traders looking to maximize their operational efficiency and continually improve their market analysis methods.
Technical Description
The RSI Swing Indicator is based on several input variables that traders can customize according to their specific trading needs. These variables are fundamental to adjusting the indicator to different assets and time frames.
Input Variables:
- rsiLength: Defines the RSI period. A lower value speeds up the indicator, making it more sensitive to market movements, while a higher value smooths it out, providing fewer signals but potentially more significant ones.
- rsiOverbought: Sets the overbought threshold. Traditionally set at 70, but users can adjust it to increase or decrease the frequency of overbought signals.
- rsiOversold: Sets the oversold threshold. The standard value is 30, though adjusting it can help capture signals in less volatile or more erratic markets.
Calculation of RSI Value:
The RSI value is calculated using the standard RSI formula, which compares the magnitude of recent gains to recent losses to measure the speed and change conditions of price movements:
|
1 |
rsiValue = rsi[rsiLength](rsiSource) |
Where rsiSource can be any price series, such as close, open, high, or low prices, as defined by the user.
States of Overbought and Oversold:
- isOverbought: A Boolean variable that becomes true when the
rsiValueis equal to or exceeds the overbought threshold (rsiOverbought). - isOversold: A Boolean variable that becomes true when the
rsiValueis equal to or below the oversold threshold (rsiOversold).
These conditions are crucial for identifying potential entry or exit points, based on the premise that the price could reverse after reaching these extreme zones.
Functionality of Channels and Pivot Points
Channels and pivot points are calculated based on whether the price is in an overbought or oversold state. The indicator plots these channels and points using codes that dynamically adjust their length and position based on market conditions and user inputs. This methodology allows traders to visualize support and resistance levels adjusted to the current market behavior, which is especially useful in volatile or trending markets.
The implementation of these channels and pivot points helps traders better visualize the market structure and make informed decisions based on clear and adaptive technical levels.
Practical Implementation
Implementing the RSI Swing Indicator on the ProRealTime platform is a process that involves properly adjusting the indicator’s settings to align with trading objectives and market characteristics. Here I provide a step-by-step guide on how to configure and use this indicator in your operations.
Indicator Setup:
- Enter the Code: Copy and paste the code of the RSI Swing Indicator into the programming area of the indicator.
- Adjust Parameters: Configure the parameters
rsiLength,rsiOverbought, andrsiOversoldaccording to your needs. This may vary depending on the asset and the time frame you are using. - If you prefer, you can download the code in .itf format which includes the variables already created so that you can modify them from the indicator configuration window.
Signal Interpretation:
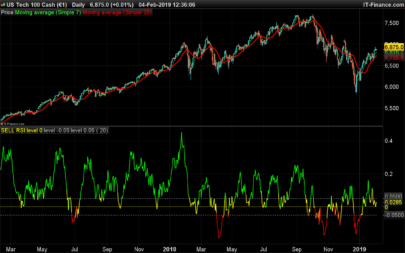
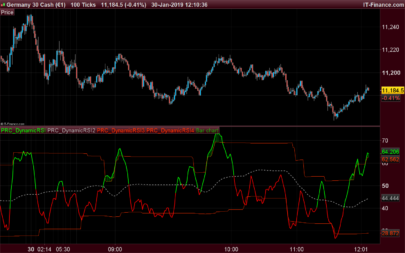
- Overbought and Oversold Signals: Observe the areas where the RSI crosses the defined thresholds for overbought and oversold. These are potential opportunities to consider entering or exiting positions, expecting a possible price reversal.
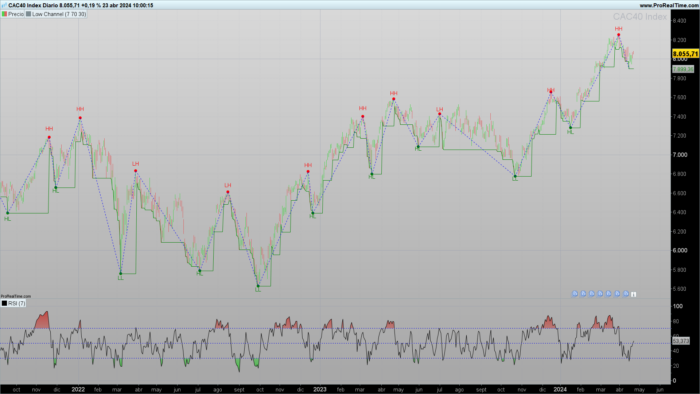
- Channels and Pivots: Pay attention to how the high and low channels form and where pivot points appear. A low pivot point followed by a higher one may indicate an emerging bullish trend, while a high pivot point followed by a lower one could suggest a bearish trend.
Practical Examples:
- Range Trading: Use the indicator to identify bounces within a range established by the overbought and oversold pivots.
- Trends: During trends, pivot points can help identify retracements or corrections within a larger trend.
This practical approach will allow you not only to follow the standard conditions of the RSI but also to leverage a deeper and adaptive market analysis with the help of channels and pivot points.
Code
Below is the complete code of the RSI Swing Indicator, which includes the logic to calculate and visualize the states of overbought and oversold, as well as the channels and pivot points:
|
1 2 3 4 5 6 7 8 9 10 11 12 13 14 15 16 17 18 19 20 21 22 23 24 25 26 27 28 29 30 31 32 33 34 35 36 37 38 39 40 41 42 43 44 45 46 47 48 49 50 51 52 53 54 55 56 57 58 59 60 61 62 63 64 65 66 67 68 69 70 71 72 73 74 75 76 77 78 79 80 81 82 83 84 85 |
//--------------------------------------------------------------// //PRC_RSI Swing Indicator //version = 0 //23.04.24 //Iván González @ www.prorealcode.com //Sharing ProRealTime knowledge //--------------------------------------------------------------// //----Inputs----------------------------------------------------// rsisource=customclose rsiLength=7 rsioverbought=70 rsioversold=30 //--------------------------------------------------------------// //-----RSI value------------------------------------------------// rsivalue=rsi[rsilength](rsiSource) //-----Current State--------------------------------------------// isOverbought = rsiValue >= rsiOverbought isOversold = rsiValue <= rsioversold //--------------------------------------------------------------// //-----High and low channel-------------------------------------// //---Low: calculated when is not overbought if isOverbought then notob=0 else notob=notob+1 pl=lowest[notob](low) plx=barindex-barssince(pl=low) endif //---High: calculated when is not oversold if isOversold then notos=0 else notos=notos+1 ph=highest[notos](high) phx=barindex - barssince(ph=high) endif //--------------------------------------------------------------// //-----Pivot Points (High&Low)----------------------------------// //---Check after exit oversold state if isoversold[1] and not isoversold then prevlastosx=lastosx//keep the previous pivot barindex lastosx=plx//set the new pivot barindex //---Draw only if is the last high if lastosx>lastobx and prevlastosx < lastobx then lasty1=y1 x1=phx[1] y1=ph[1] drawpoint(x1,y1,2)coloured("red") drawsegment(x1,y1,x2,y2)coloured("blue")style(dottedline) if lasty1 > y1 then drawtext("LH",x1,y1+0.5*tr)coloured("red") else drawtext("HH",x1,y1+0.5*tr)coloured("red") endif endif endif //---Check after exit overbought state if isOverbought[1] and not isOverbought then prevlastobx=lastobx//keep the previous pivot barindex lastobx=phx//set the new pivot barindex //---Draw only if is the last low if lastobx>lastosx and prevlastobx < lastosx then lasty2=y2 x2=plx[1] y2=pl[1] drawpoint(x2,y2,2)coloured("green") drawsegment(x2,y2,x1,y1)coloured("blue")style(dottedline) if lasty2 > y2 then drawtext("LL",x2,y2-0.5*tr)coloured("green") else drawtext("HL",x2,y2-0.5*tr)coloured("green") endif endif endif //--------------------------------------------------------------// //-----Draw the last segment------------------------------------// if islastbarupdate then if x1 > x2 then drawsegment(x1,y1,plx,pl)coloured("blue")style(dottedline) else drawsegment(x2,y2,phx,ph)coloured("blue")style(dottedline) endif endif //--------------------------------------------------------------// return //pl as "Low Channel"coloured("green"), ph as "High Channel"coloured("red") |
This code can be adapted or modified according to the specific needs of the user.
Conclusion
The RSI Swing Indicator represents a robust and adaptable technical analysis tool, capable of providing valuable insights into market dynamics. Through its clear visual signals and precise identification of overbought and oversold zones, this indicator facilitates more informed and strategically founded trading decisions.
We encourage you to experiment with this indicator, adjusting its parameters and applying it to different markets to see how it can improve your trading. Customization and continuous practice are key to maximizing the capabilities of any analytical tool in trading.
Share this
No information on this site is investment advice or a solicitation to buy or sell any financial instrument. Past performance is not indicative of future results. Trading may expose you to risk of loss greater than your deposits and is only suitable for experienced investors who have sufficient financial means to bear such risk.
ProRealTime ITF files and other attachments :
Find other exclusive trading pro-tools on ![]()
PRC is also on YouTube, subscribe to our channel for exclusive content and tutorials


bONSOIR
Est ce normal que les droites se démultiplient en plusieurs droites
quelle difference y a til entre HL et LL svp
ci joint une copie d’ecran pour le dedoublement des droites
cdlt
j ai fait une copie d’ecran mais je ne sais pas comment l’envoyer sur le site
This indicator re-paint?
Hi,
Sorry, but what do you mean?
Hola, queria saber si el indicador repinta, porque a mi me parecio que si. Saludos y gracias por todos tus excelentes aportes.
Bonsoir,
L’un d’entre vous peut-il me donner les définissions de LL-HH-LH et HL. Merci d’avance