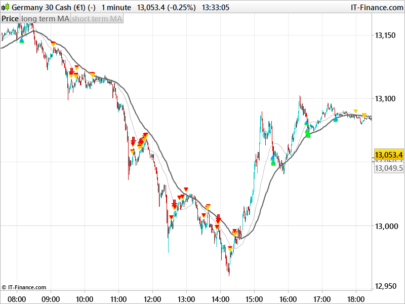
– On the basis of a program written by Leo entitled “LEO MOVING AVERAGE” I propose a simple strategy to initiate positions in “Against Trend” on detection of new higher or lower …
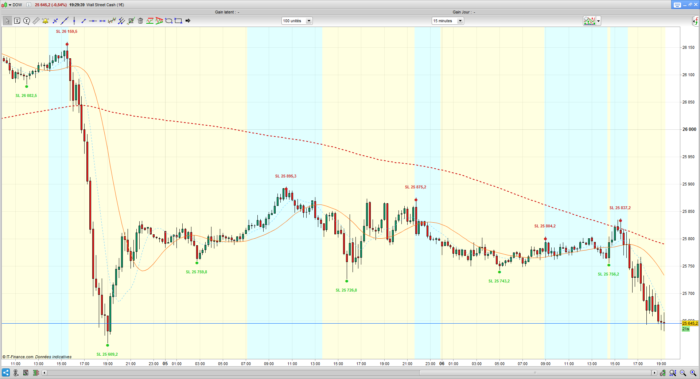
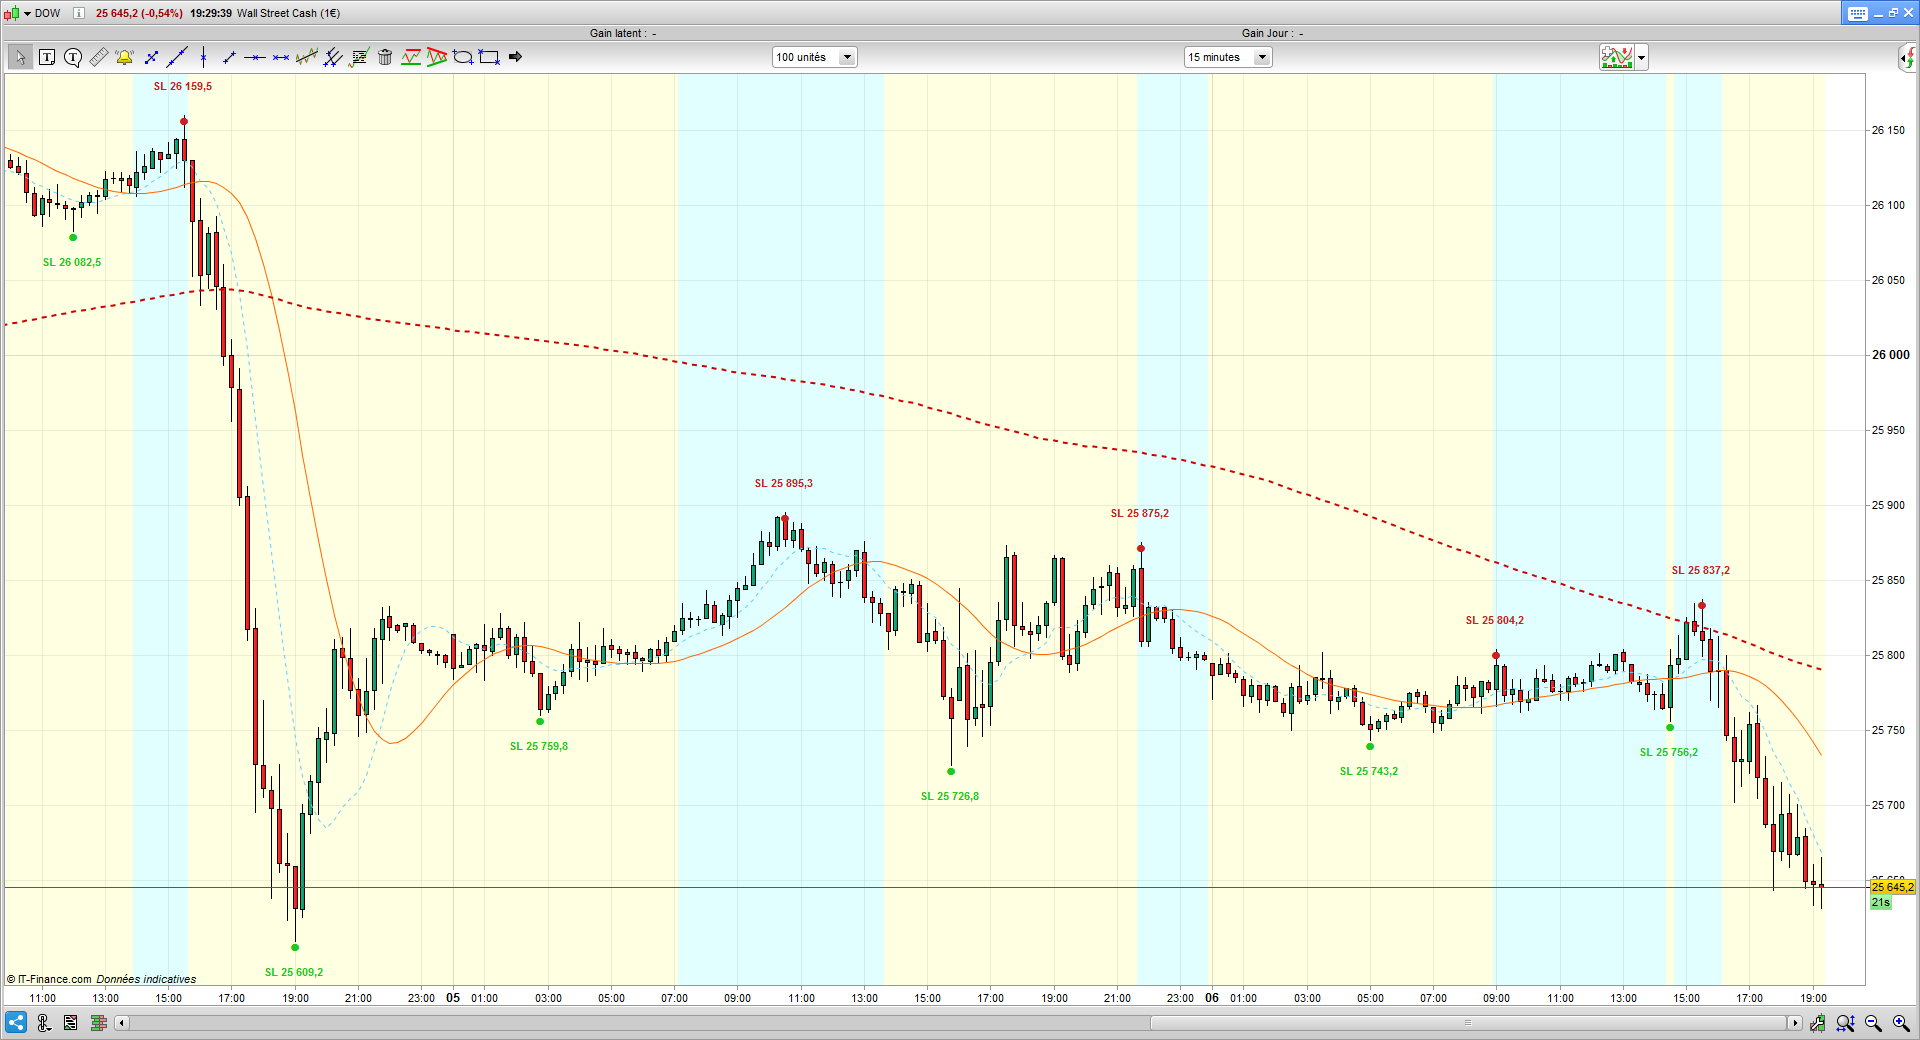
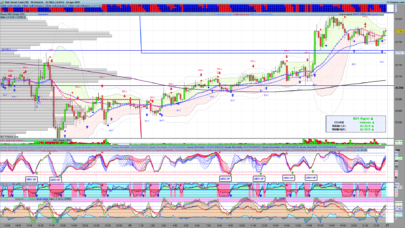
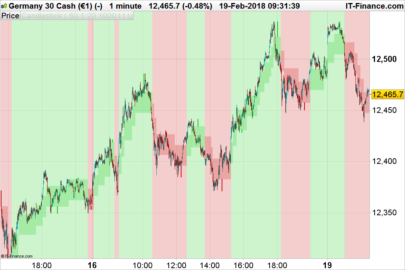
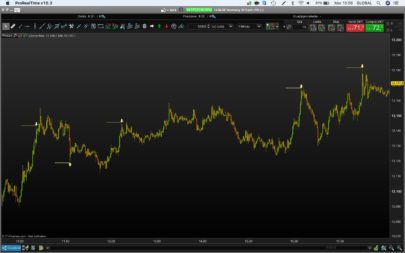
– The program displays the maximum and minimum levels, indicates the position and the direction of the input with a planned Stop Loss indicating the extreme points. It colors the background trend on the unit of time used in blue if the asset is bullish or yellow if it is bearish. A simple 200-period moving average was added to validate the medium-term trend …
Variables make it possible to adapt this strategy to your liking:
- “Period” Value of LMA moving average
- “Offset” Adjust distance text Stop Loss of the candle
- “Color” Adjusting temperature background color
- “BackColor” Mask the background color (visual option)
- “Text” Hidden text “Stop Loss”
|
1 2 3 4 5 6 7 8 9 10 11 12 13 14 15 16 17 18 19 20 21 22 23 24 25 26 27 28 29 30 31 32 33 34 35 36 37 38 39 40 41 42 43 44 45 46 47 48 49 50 51 52 53 54 55 56 57 58 59 60 61 62 63 64 65 66 67 68 69 70 71 72 73 74 75 76 77 78 |
// Scalping Counter Trend | Graph Indicator // 06.03.2019 (Release 1.0) // Swapping @ www.forexswap.fr // Sharing ProRealTime knowledge (alt+16) // Program adapted from "LEO MOVING AVERAGE" indicator created by LEO contributer of website ProrealCode.com // --- Property Settings --- Period = 20 // (Value Leo Moving Average) Offset = 12 // (offset text candle) Color = 33 // (transparency background) BackColor = 1 // 0=true; 1=false (option background color) Text = 1 // 0=false; 1=true (option text hidden) // --- end color = max(color,0) // Limited input "Max-Min" data color = min(color,255) // supports and resistances once support = low once resistance = high LMA = 2*weightedaverage[period](close)-average[period](close) smoothLMA = weightedaverage[period](LMA) sma = average[200](customclose) // ---> Storage of minimums and maximums if barindex > 1 then if low < lowest[period](low[1]) then mintemp = low // minimum temporal posmintemp = barindex // position of minimum temporal direction = 1 // Background Color Chart and Segment if direction = 1 then endif endif if high > highest[period](high[1]) then maxtemp = high // maximum temporal posmaxtemp = barindex // position maximum temporal direction = -1 // Background Color Chart and Segment if direction = -1 then endif endif endif // ---> Background Color Chart with (enable or disable) condition if BackColor = 1 and direction < 0 then BackGroundColor(0,255,255,color) // Bullish blue else BackGroundColor(255,255,0,color) // Bearish yellow endif if BackColor = 0 then // BackgroundColor disabled BackGroundColor(0,0,0,0) endif if LMA crosses over smoothLMA then // --> Detecting and locating a local minimum LEVMIN = mintemp POSLEVMIN = posmintemp support = LEVMIN //DrawArrowUp(POSLEVMIN+0,LEVMIN-2) coloured(20,200,0,170) // Option Arrow Up DrawText("•",poslevmin,levmin-offset*0.2,Serif,Bold,16) coloured(33,200,33) // Glyphe alt+7 if Text = 1 then DrawText("SL #levmin#",poslevmin,levmin-offset,SansSerif,Bold,11) coloured(33,200,33) endif elsif LMA crosses under smoothLMA then // --> Detecting and locating a local maximum LEVMAX = maxtemp POSLEVMAX = posmaxtemp resistance = LEVMAX //DrawArrowDown(POSLEVMAX+0,LEVMAX+2) coloured(200,20,0,170) // Option Arrow Down DrawText("•",poslevmax,levmax-offset*0.2,Serif,Bold,16) coloured(200,33,33) // Glyphe alt+7 if Text = 1 then DrawText("SL #levmax#",poslevmax,levmax+offset,SansSerif,Bold,11) coloured(200,33,33) endif endif support = min(low,support) resistance = max(high,resistance) return LMA as " LMA", resistance coloured by resistance as " Resistance", support coloured by support as " Support", smoothLMA coloured by smoothLMA as " smoothLMA", sma coloured by sma as " SMA" |
Share this
No information on this site is investment advice or a solicitation to buy or sell any financial instrument. Past performance is not indicative of future results. Trading may expose you to risk of loss greater than your deposits and is only suitable for experienced investors who have sufficient financial means to bear such risk.
ProRealTime ITF files and other attachments :PRC is also on YouTube, subscribe to our channel for exclusive content and tutorials

it’s great work, but is it repainted? In any case good job.
he is extremely late. Too bad
Could you give some explanation about this indicator. How long does it take to have a new high/low signal when it happens ? How many bars / candles ?
Good system, but no dots on FX-Pairs like GBP/USD. Could you explain why and fix it maybe?
Hello Schmarotzer, for the forex it is necessary to put offset to “0” !
I forgot to specify it …
Nice… the fact that there are a Maximum or Minimum with a Long term Bias can be a powerfull resource….
I am glad that this indicator is usefull.
Thank you very much Leo, I will make other mix that can be interesting with different code of this community …
Best regards 😉
Hi .. how can we get this indicator for MT4 platform
You can ask for private custom coding to our programming services: https://www.prorealcode.com/trading-programming-services/
Nicolas
Could you code in PRT from an MT4 code ?
Best JC
ciao… fa repaint ?
Troppo bello per essere vero. il segnale lo da in ritardo ….. direi INUTILE e magari sarebbe bene non pubblicare indicatori che fanno repaint sono cose di 100 anni fa
легко критиковать показатели, закодированные в мое свободное время и оставленные бесплатно, но ничего не принося сообществу
giusto, la critica è troppo severa. Mi dispiace che l’indicatore abbia delle lacune perchè sarebbe veramente utile e l’idea ottima. Io non so programmare , mi limito a testare . Se posso rendermi utile in questo sono a disposizione.
Great work, much appreciated!
You think this will work better with HULL indicator? So the SL prints instantly.
Works fine on FOREX
very late to identify signal
Nicolas
How to convert this signal into a strategy pro ?
Best JC
Still learning and very new to all this. Can this indicator be turned into an automated trade bot thru the PR platform?
Yes sure, please create a dedicated post in the automated trading forum.
Hi is it possible to replace the dots with red/green vertical lines? Thank you.