

Scatter Plot Analysis of RSI, Stochastic, Williams%R and ADX
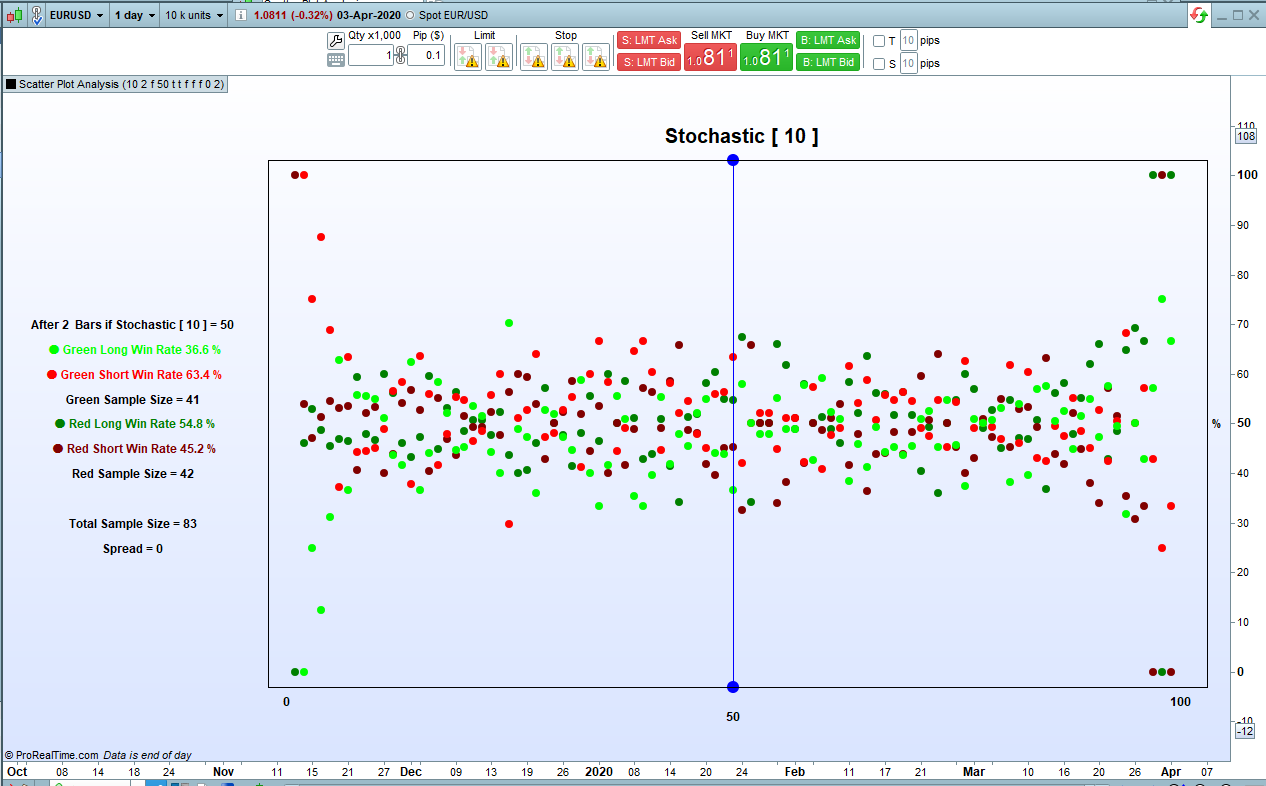
This indicator can analyse the four indicators RSI, Stochastic, Williams%R and ADX and present the results in a scatter chart.
This indicator only works on PRTv11 onwards.
Each of these bounded indicators returns a result between zero and 100. Every candles returned value is calculated rounded up and then a win rate and profit and loss calculated on where price was ‘BarsAfter’ candles later and stored for that returned indicator value. The results are further separated into results for if our tested candle was a red candle or a green candle. The results are then displayed in a scatter chart and also as text to the left of the scatter chart. Sample size is also calculated and displayed so that we can see how big a sample the results are calculated on.
So for example on the DJI daily if we check the RSI indicator and base our calculations on 2 bars after we can see that if the RSI returned a value of 35 (actually >34 and <=35) then we had 192 candles in our history with an RSI value of 35 with 57 of them being green and 135 red. We can then also see the win rate for if we went long on green candles with RSI=35 and exited after two bars or short on green candles with RSI=35 and exited after two bars – and the same for long on red or short on red.
If we switch ‘ProfitLoss’ on then the scatter chart changes so we can see how much each trade direction would have won or lost. The scatter chart y axis is calculated to represent the most profitable indicator value return at 100% and the worst at 0%.
The x axis always represents the indicator returned values between zero and 100.
The indicator has two modes. ‘Live’ or not live. In Live mode the results and scatter plot display change to only show results for the current candle colour and current chosen indicator return value for the current candle. In ‘Not Live’ mode you can enter a ‘Value’ and check the results for any indicator returned value for any colour candle. In ‘Live’ mode the blue line represents the current candles indicator returned value location on the scatter chart and it will move up and down as this changes. The points at the top and bottom of the blue line change colour from red to green depending on current candle colour. In ‘Not Live’ mode the points of the line are blue and the blue line is located on whatever you have set ‘Value’ to be.
You can set a ‘Spread’ to be used in the profit and loss calculations. Spread is not taken into account when calculating the win rates however.
You can also set ‘DecimalPlaces’ to display more or less decimal places in the profit and loss displayed results.
Set ‘p’ to whatever period of your chosen indicator you want to analyse.
There are four tick boxes to choose an indicator. If no boxes are ticked then the default is RSI but if you tick more than one box then the order of display priority is ADX then Williams%R then Stochastic.
As always I advise downloading and importing to get full functionality.
//Scatter Plot Analysis
//By Vonasi
//Date 20200405

defparam drawonlastbaronly = true

//p = 1 //Period to use in chosen indicator
//BarsAfter = 1 //Number of bars later to record result on
//Live = 0 //Switch between Live analysis and static analysis. Live = 1 Static = 0
//Value = 50 //Indicator returned result to see results of in static analysis
//RSIndex = 1 //Analyse RSI[p] indicator results
//Stoch = 0 //Analyse Stochastic[p] indicator results
//WilliamsR = 0 //Analyse Williams%R[p] indicator results
//ADXIndex = 0 //Analyse ADX[p] indicator results
//ProfitLoss = 0 //Display Profit and Loss or Win Rate results 1 = Profit and Loss 0 = Win Rate
//Spread = 0 //Spread to use in profit and loss calculations.
//DecimalPlaces = 2 //Number of decimal places to display profit and loss results to

p = max(1,p)
value = max(1,value)
value = min(100,value)
barsafter = max(1,barsafter)
spread = max(0,spread)
decimalplaces = max(0,decimalplaces)

if RSIndex or not RSIndex then
indicator = rsi[p]
indtype = 1
endif
if stoch then
indicator = stochastic[p,3]
indtype = 2
endif
if williamsR then
indicator = abs(williams[p])
negflag = 1
indtype = 3
endif
if adxindex then
indicator = adx[p]
indtype = 4
endif

if live then
thisresult = round(indicator)
else
thisresult = value
endif

BarsAfter = max(BarsAfter,1)

indicatorvalue = round(indicator[barsafter])

if indicatorvalue >=1 and barindex > barsafter then

if negflag then
drawtext("-100",barindex-1,-6,sansserif,bold,12)
drawtext(" -#thisresult#",barindex-(101-thisresult),-9,sansserif,bold,12)
else
drawtext("100",barindex-1,-6,sansserif,bold,12)
drawtext(" #thisresult#",barindex-(101-thisresult),-9,sansserif,bold,12)
endif

redbar = 0
greenbar = 0
if close < open THEN
redbar = 1
endif

if close >= open THEN
greenbar = 1
endif

if not profitloss then
//red close down
if close < close[barsafter] and close[barsafter] < open[barsafter] then
$redshortwin[indicatorvalue] = $redshortwin[indicatorvalue]+1
endif
//red close up
if close > close[barsafter] and close[barsafter] < open[barsafter] then
$redlongwin[indicatorvalue] = $redlongwin[indicatorvalue]+1
endif
//green close up
if close > close[barsafter] and close[barsafter] > open[barsafter] then
$greenlongwin[indicatorvalue] = $greenlongwin[indicatorvalue]+1
endif
//green close down
if close < close[barsafter] and close[barsafter] > open[barsafter] then
$greenshortwin[indicatorvalue] = $greenshortwin[indicatorvalue]+1
endif
else
if close[barsafter] < open[barsafter] then
//red short
$redshortprofit[indicatorvalue] = $redshortprofit[indicatorvalue]+((close[barsafter]-close)-spread)
//red long
$redlongprofit[indicatorvalue] = $redlongprofit[indicatorvalue]+((close-close[barsafter])-spread)
$redsample[indicatorvalue] = $redsample[indicatorvalue] + 1
endif
if close[barsafter] > open[barsafter] then
//green long
$greenlongprofit[indicatorvalue] = $greenlongprofit[indicatorvalue]+((close-close[barsafter])-spread)
//green short
$greenshortprofit[indicatorvalue] = $greenshortprofit[indicatorvalue]+((close[barsafter]-close)-spread)
$greensample[indicatorvalue] = $greensample[indicatorvalue] + 1
endif

maxprofit = max(max(max(max($redshortprofit[indicatorvalue],$redlongprofit[indicatorvalue]),$greenlongprofit[indicatorvalue]),$greenshortprofit[indicatorvalue]),maxprofit)
minprofit = min(min(min(min($redshortprofit[indicatorvalue],$redlongprofit[indicatorvalue]),$greenlongprofit[indicatorvalue]),$greenshortprofit[indicatorvalue]),minprofit)
endif

if islastbarupdate then
for d = 100 downto 1
c = 101 - d
if not profitloss then
$redlongwinperc[d] = ($redlongwin[d]/($redlongwin[d]+$redshortwin[d]))*100
$redshortwinperc[d] = ($redshortwin[d]/($redlongwin[d]+$redshortwin[d]))*100
$greenshortwinperc[d] = ($greenshortwin[d]/($greenshortwin[d]+$greenlongwin[d]))*100
$greenlongwinperc[d] = ($greenlongwin[d]/($greenshortwin[d]+$greenlongwin[d]))*100
else
profitrange = maxprofit - minprofit
$redlongwinperc[d] = (($redlongprofit[d]- minprofit)/(profitrange))*100
$redshortwinperc[d] = (($redshortprofit[d]- minprofit)/(profitrange))*100
$greenshortwinperc[d] = (($greenshortprofit[d]- minprofit)/(profitrange))*100
$greenlongwinperc[d] = (($greenlongprofit[d]- minprofit)/(profitrange))*100
endif

if redbar or not live then
drawpoint(barindex-c,$redlongwinperc[d],2)coloured(0,128,0)
drawpoint(barindex-c,$redshortwinperc[d],2)coloured(128,0,0)
endif
if redbar and live then
drawtext("Red Candle",barindex-118,60,sansserif,bold,14)coloured(128,0,0)
endif
if greenbar or not live then
drawpoint(barindex-c,$greenshortwinperc[d],2)coloured(255,0,0)
drawpoint(barindex-c,$greenlongwinperc[d],2)coloured(0,255,0)
endif
if greenbar and live then
drawtext("Green Candle",barindex-118,60,sansserif,bold,14)coloured(0,255,0)
endif

if not profitloss then
redsample = $redshortwin[thisresult]+$redlongwin[thisresult]
greensample = $greenshortwin[thisresult]+$greenlongwin[thisresult]
else
redsample = $redsample[thisresult]
greensample = $greensample[thisresult]
endif

if thisresult =  d then
yp = 55
zp = 35
drawsegment(barindex-c,-2,barindex-c,103)coloured(0,0,255)
if greenbar and live then
drawpoint(barindex-c,-3,3)coloured(0,255,0)
drawpoint(barindex-c,103,3)coloured(0,255,0)
if not profitloss then
shortrate = round($greenshortwinperc[d],1)
longrate = round($greenlongwinperc[d],1)
drawtext("● Long Win Rate #longrate#%",barindex-118,50,sansserif,bold,12)coloured(0,255,0)
drawtext("● Short Win Rate #shortrate#%",barindex-118,45,sansserif,bold,12)coloured(255,0,0)
else
shortrate = round($greenshortprofit[d],decimalplaces)
longrate = round($greenlongprofit[d],decimalplaces)
if longrate < 0 then
drawtext("● Long Loss #longrate#",barindex-118,50,sansserif,bold,12)coloured(0,255,0)
else
drawtext("● Long Profit #longrate#",barindex-118,50,sansserif,bold,12)coloured(0,255,0)
endif
if shortrate < 0 then
drawtext("● Short Loss #shortrate#",barindex-118,45,sansserif,bold,12)coloured(255,0,0)
else
drawtext("● Short Profit #shortrate#",barindex-118,45,sansserif,bold,12)coloured(255,0,0)
endif
endif
drawtext("Sample Size = #greensample#",barindex-118,40,sansserif,bold,12)
endif

if redbar and live then
drawpoint(barindex-c,-3,3)coloured(128,0,0)
drawpoint(barindex-c,103,3)coloured(128,0,0)
if not profitloss then
shortrate = round($redshortwinperc[d],1)
longrate = round($redlongwinperc[d],1)
drawtext("● Long Win Rate #longrate#%",barindex-118,50,sansserif,bold,12)coloured(0,128,0)
drawtext("● Short Win Rate #shortrate#%",barindex-118,45,sansserif,bold,12)coloured(128,0,0)
else
shortrate = round($redshortprofit[d],decimalplaces)
longrate = round($redlongprofit[d],decimalplaces)
if longrate < 0 then
drawtext("● Long Loss #longrate#",barindex-118,50,sansserif,bold,12)coloured(0,128,0)
else
drawtext("● Long Profit #longrate#",barindex-118,50,sansserif,bold,12)coloured(0,128,0)
endif
if shortrate < 0 then
drawtext("● Short Loss #shortrate#",barindex-118,45,sansserif,bold,12)coloured(128,0,0)
else
drawtext("● Short Profit #shortrate#",barindex-118,45,sansserif,bold,12)coloured(128,0,0)
endif
endif
drawtext("Sample Size = #redsample#",barindex-118,40,sansserif,bold,12)
endif

if not live then
yp = 70
zp = 25
drawpoint(barindex-c,-3,3)coloured(0,0,255)
drawpoint(barindex-c,103,3)coloured(0,0,255)
if not profitloss then
shortrate = round($greenshortwinperc[d],1)
longrate = round($greenlongwinperc[d],1)
drawtext("● Green Long Win Rate #longrate#%",barindex-118,65,sansserif,bold,12)coloured(0,255,0)
drawtext("● Green Short Win Rate #shortrate#%",barindex-118,60,sansserif,bold,12)coloured(255,0,0)
drawtext("Green Sample Size = #greensample#",barindex-118,55,sansserif,bold,12)
shortrate = round($redshortwinperc[d],1)
longrate = round($redlongwinperc[d],1)
drawtext("● Red Long Win Rate #longrate#%",barindex-118,50,sansserif,bold,12)coloured(0,128,0)
drawtext("● Red Short Win Rate #shortrate#%",barindex-118,45,sansserif,bold,12)coloured(128,0,0)
drawtext("Red Sample Size = #redsample#",barindex-118,40,sansserif,bold,12)
else
shortrate = round($greenshortprofit[d],decimalplaces)
longrate = round($greenlongprofit[d],decimalplaces)
if longrate < 0 then
drawtext("● Green Long Loss #longrate#",barindex-118,65,sansserif,bold,12)coloured(0,255,0)
else
drawtext("● Green Long Profit #longrate#",barindex-118,65,sansserif,bold,12)coloured(0,255,0)
endif
if shortrate < 0 then
drawtext("● Green Short Loss #shortrate#",barindex-118,60,sansserif,bold,12)coloured(255,0,0)
else
drawtext("● Green Short Profit #shortrate#",barindex-118,60,sansserif,bold,12)coloured(255,0,0)
endif
drawtext("Green Sample Size = #greensample#",barindex-118,55,sansserif,bold,12)
shortrate = round($redshortprofit[d],decimalplaces)
longrate = round($redlongprofit[d],decimalplaces)
if longrate < 0 then
drawtext("● Red Long Loss #longrate#",barindex-118,50,sansserif,bold,12)coloured(0,128,0)
else
drawtext("● Red Long Profit #longrate#",barindex-118,50,sansserif,bold,12)coloured(0,128,0)
endif
if shortrate < 0 then
drawtext("● Red Short Loss #shortrate#",barindex-118,45,sansserif,bold,12)coloured(128,0,0)
else
drawtext("● Red Short Profit #shortrate#",barindex-118,45,sansserif,bold,12)coloured(128,0,0)
endif
drawtext("Red Sample Size = #redsample#",barindex-118,40,sansserif,bold,12)
endif
sample = greensample + redsample
drawtext("Total Sample Size = #sample#",barindex-118,30,sansserif,bold,12)
endif


drawsegment(barindex-103,-3,barindex-103,103)
drawsegment(barindex+2,-3,barindex+2,103)
drawsegment(barindex-103,-3,barindex+2,-3)
drawsegment(barindex-103,103,barindex+2,103)
if indtype = 1 then
drawtext("Relative Strength Index [ #p#]",barindex-50,108,sansserif,bold,20)
drawtext("After #barsafter# Bars if RSI [ #p#] = #thisresult#",barindex-118,yp,sansserif,bold,12)
//drawtext("RSI Value",barindex-(100-thisresult),-11,sansserif,bold,12)
endif
if indtype = 2 then
drawtext("Stochastic [ #p#]",barindex-50,108,sansserif,bold,20)
drawtext("After #barsafter# Bars if Stochastic [ #p#] = #thisresult#",barindex-118,yp,sansserif,bold,12)
//drawtext("Stochastic Value",barindex-(100-thisresult),-11,sansserif,bold,12)
endif
if indtype = 3 then
drawtext("Williams%R [ #p#]",barindex-50,108,sansserif,bold,20)
drawtext("After #barsafter# Bars if Williams%R [ #p#] = #thisresult#",barindex-118,yp,sansserif,bold,12)
//drawtext("Williams%R Value",barindex-(100-thisresult),-11,sansserif,bold,12)
endif
if indtype = 4 then
drawtext("Average Directional Index [ #p#]",barindex-50,108,sansserif,bold,20)
drawtext("After #barsafter# Bars if ADX [ #p#] = #thisresult#",barindex-118,yp,sansserif,bold,12)
//drawtext("ADX Value",barindex-(100-thisresult),-11,sansserif,bold,12)
endif
drawtext("Spread = #spread#",barindex-118,zp,sansserif,bold,12)
drawtext("0",barindex-101,-6,sansserif,bold,12)
drawtext("%",barindex+3,50,sansserif,bold,12)
endif
next
endif
endif

return 108 coloured(0,0,0,0),-12 coloured(0,0,0,0)