







Seasonal & Cycle (Monthly Average & Probability)
Hi All,
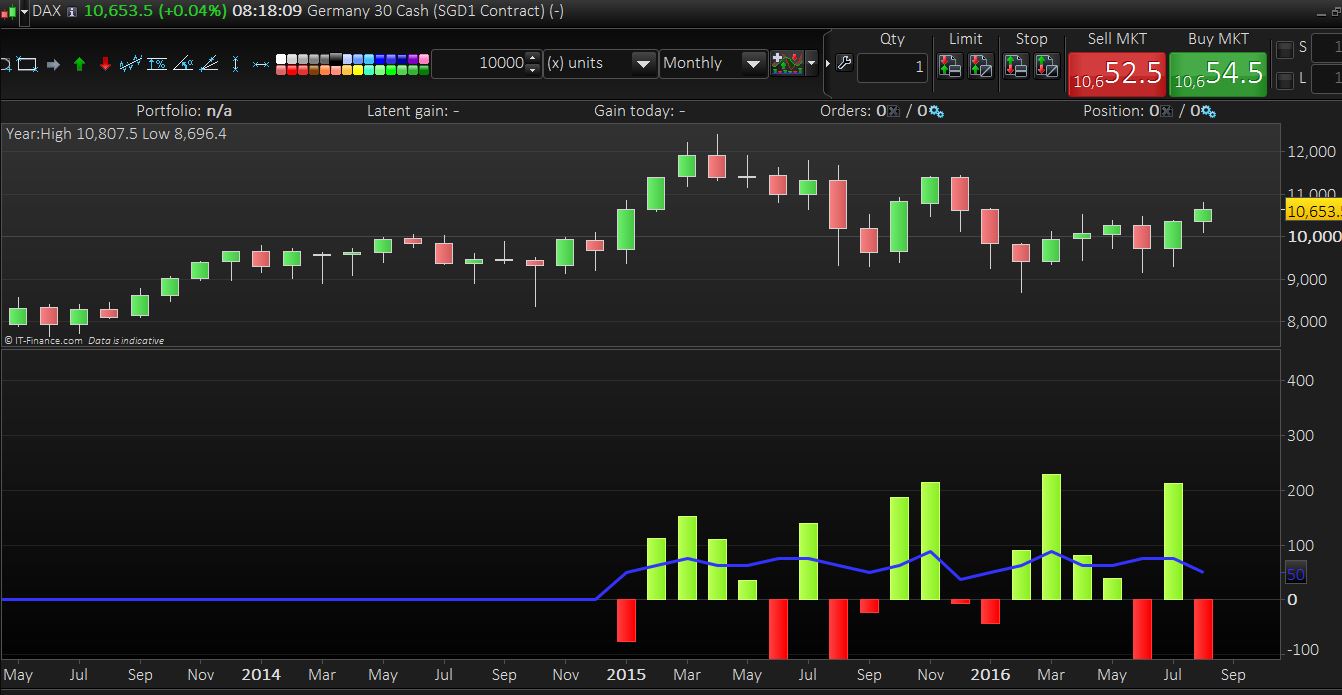
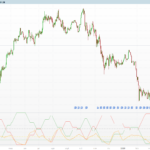
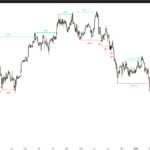
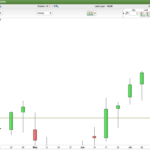
I’m here to share a simple indicator that i use to calculate the average monthly price (Open – Close) and probability of previous years. No. of years can be configured in parameter, default value is 8 years. I use DAX monthly chart as example, you can use it on stocks, indices and etc. It can be useful indicator / filter on your trading strategy to control the quantity on high probability month. You also can modify the code to measure to average monthly price + shadow (high – low), and in “weeks” if you prefer.
Your suggestions are welcome.
br,
CKW
m = 0
AverageMon = 0
Positive = 0
Negative = 0
Pb = 0

If Year > 2014 then
 For loop = 1 to Years do
  AverageMon = (Close[m] - Open[m]) + AverageMon
  If (Close[m] - Open[m]) > 0 then
   Positive = Positive + 1
  else
   Negative = Negative + 1
  endif
 m = m + 12
 next

 If AverageMon > 0 then
  Pb = Positive
   else
  Pb = Negative
 endif

endif

Return AverageMon/(Years) as "Avg Price", ABS(Pb/Years)*100 as "Probability"
Comments
You must be logged in to post a comment.

Hey! Thank so much for sharing this wonderful indicator! I have always tried to code a similar indicator, but unfortunately I haven't had the knowledge to do so.
PRT tells me that "Years" are not defined. Has somebody had a similar problem? What to do about it? Could someone please help me?
Best regards, Philip
Years not defined was probably b/c Phillip copied and pasted the code into PRT instead of importing the .itf file. In his case, he just needs to add the variable years as an integer, default value 8.
On the monthly chart as instructed, I found this highly correlates with other reading I've found about the seasonality of the USDJPY, though I found better accuracy when I set the years to a period that excluded the excessive swings post-financial crisis.
On a constructive note, I tried a crude modification setting the look-forward to +24, and tried it on the hourly chart. I was not previously aware of a time-of-day cycle to hourly up/down probabilities. I found some highly regular patterns for time of day. So that was surprisingly useful.
What was even more confusing/surprising is that the original +12 showed an even higher correlation for the exact same 24-hour cycle than my +24 edit. I'm still a bit new to trading, so I cannot explain this very visible pattern in terms of fundamental market drivers for the USDJPY.