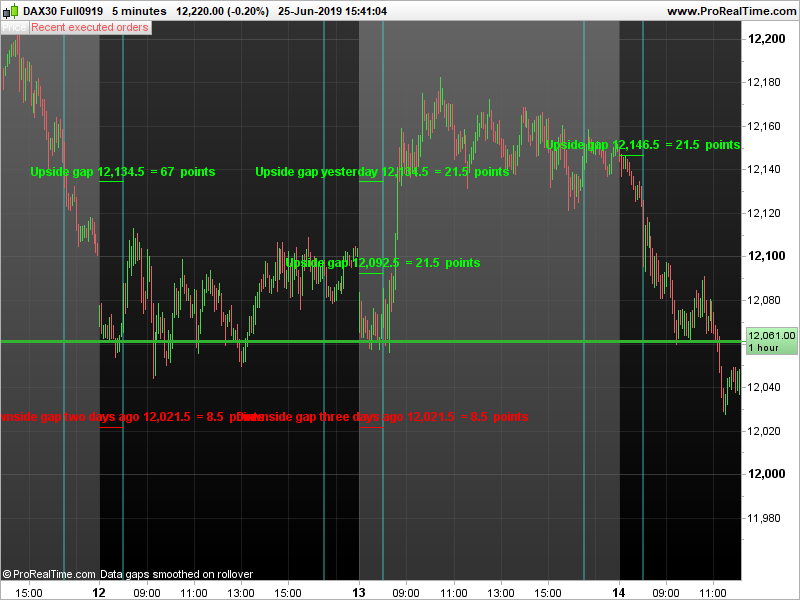
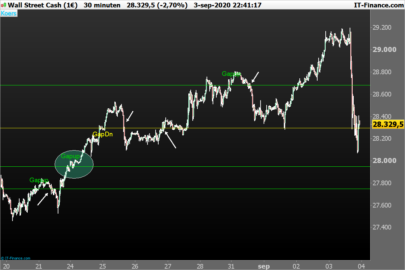
It’s easy to get lost in the sea of indicators and strategies out there, but one thing that is frequently overlooked these days is the simple gap. Often this gives us a great steer as to market direction from the open, especially if the market is at important support/resistance or in ‘overbought’/’oversold’ territory. The DAX seems to be particularly ripe for gap trading.
My code considers not just today’s gap (relative to yesterday’s close), but the previous three days’. It’s up to you to decide how likely it is that each gap will fill (I wish I could write some code that could assist here, but suspect this is beyond the current scope of PRT – ideas welcome), but I think it’s quite neat to have these levels preloaded on your chart as you prepare for the day ahead.
The code gives you the ability to change the trading hours, which I think is important, though I also believe that the markets seem to respect 8am London time (9am CET) as the ‘official’ open and 4.35pm London time (5.35pm CET) as the ‘official’ close on which gaps are evaluated so for instance if the market continues to drift lower in the evening session and then then opens at a similar level the following day, it will still tend to seek out the 4.35pm close from the previous day even though the charts will show there is no gap per se. As I am based in the UK, those users in other timezones will have to adapt the respective times in the code to their own timezone.
Why not just use DOpen, DHigh, DLow, DClose with custom trading hours you may ask? Because it occurred to me yesterday (I may be mistaken) that even when you play around with the trading hours, the DOpen/High/Low/Close values remain the same, i.e. they reflect the respective values over the entire 24-hour session, or maybe it’s because I didn’t tick the ‘Apply settings above to non-intraday timeframes’. Anyway I feel more confident using my manually coded versions…
Please feel free to suggest how to expand/improve the code.
|
1 2 3 4 5 6 7 8 9 10 11 12 13 14 15 16 17 18 19 20 21 22 23 24 25 26 27 28 29 30 31 32 33 34 35 36 37 38 39 40 41 42 43 44 45 46 47 48 49 50 51 52 53 54 55 56 57 58 59 60 61 62 63 64 65 66 67 68 69 70 71 72 73 74 75 76 77 78 79 80 81 82 83 84 85 86 87 88 89 90 91 92 93 94 95 96 97 98 99 100 101 102 103 104 105 106 107 108 109 110 111 112 113 114 115 116 117 118 119 120 121 122 123 124 125 126 127 128 129 130 131 132 133 134 135 136 137 138 139 140 |
DEFPARAM DrawOnLastBarOnly = False // HOffset = 3 VOffset = (5*pointsize) i = IntradayBarIndex MarketOpenTime = 080000 // Must be adapted to timeframe on chart CashMarketCloseTime = 163500 // Must be adapted to timeframe on chart FuturesMarketCloseTime = 180000 // Must be adapted to custom trading hours on charts IF Time[1] = MarketOpenTime THEN b = i BackgroundColor(64,224,208,100) ENDIF IF Time = CashMarketCloseTime THEN c = i BackgroundColor(64,224,208,100) ENDIF IF Time = FuturesMarketCloseTime THEN d = i ENDIF IF d > b AND d > c THEN YesterdaysOpen = Open[i+(d-c)+(c-b)+1] YesterdaysHigh = HighofDaysRange[i+(d-c)+1] YesterdaysLow = LowofDaysRange[i+(d-c)+1] YesterdaysClose = Close[i+(d-c)+1] OpenTwoDaysAgo = Open[i+d+(d-c)+(c-b)+2] HighTwoDaysAgo = HighofDaysRange[i+d+(d-c)+2] LowTwoDaysAgo = LowofDaysRange[i+d+(d-c)+2] CloseTwoDaysAgo = Close[i+d+(d-c)+2] OpenThreeDaysAgo = Open[i+(2*d)+(d-c)+(c-b)+3] HighThreeDaysAgo = HighofDaysRange[i+(2*d)+(d-c)+3] LowThreeDaysAgo = LowofDaysRange[i+(2*d)+(d-c)+3] CloseThreeDaysAgo = Close[i+(2*d)+(d-c)+3] // OpenFourDaysAgo = Open[i+(3*d)+(d-c)+(c-b)+4] // HighFourDaysAgo = HighofDaysRange[i+(3*d)+(d-c)+4] // LowFourDaysAgo = LowofDaysRange[i+(3*d)+(d-c)+4] CloseFourDaysAgo = Close[i+(3*d)+(d-c)+4] ENDIF IF i = b THEN // TodaysOpen = Open // Stoploss = Open-(1*(YesterdaysLow-Open)) OpeningbarHigh = High HighofDaysRange = High OpeningbarLow = Low LowofDaysRange = Low ELSIF i >= (b+1) AND i > b THEN HighofDaysRange = MAX(OpeningbarHigh,Highest[(i-b)+1](High)) LowofDaysRange = MIN(OpeningbarLow,Lowest[(i-b)+1](Low)) ENDIF GapFillThreeDaysAgo = (OpenThreeDaysAgo < CloseFourDaysAgo AND HighThreeDaysAgo >= CloseFourDaysAgo) OR (OpenThreeDaysAgo > CloseFourDaysAgo AND LowThreeDaysAgo <= CloseFourDaysAgo) GapFillTwoDaysAgo = (OpenTwoDaysAgo < CloseThreeDaysAgo AND HighTwoDaysAgo >= CloseThreeDaysAgo) OR (OpenTwoDaysAgo > CloseThreeDaysAgo AND LowTwoDaysAgo <= CloseThreeDaysAgo) GapFillYesterday = (YesterdaysOpen < CloseTwoDaysAgo AND YesterdaysHigh >= CloseTwoDaysAgo) OR (YesterdaysOpen > CloseTwoDaysAgo AND YesterdaysLow <= CloseTwoDaysAgo) IF i = b AND GapFillThreeDaysAgo = 0 THEN IF OpenThreeDaysAgo < CloseFourDaysAgo THEN IF HighTwoDaysAgo < CloseFourDaysAgo AND YesterdaysHigh < CloseFourDaysAgo THEN UpsideGapThreeDaysAgo = CloseFourDaysAgo UpsideGapThreeDaysAgoPoints = CloseFourDaysAgo-MAX(HighThreeDaysAgo,MAX(HighTwoDaysAgo,YesterdaysHigh)) DRAWSEGMENT(Barindex-b,UpsideGapThreeDaysAgo,Barindex,UpsideGapThreeDaysAgo) COLOURED(0, 255, 0) DRAWTEXT("Upside gap three days ago #UpsideGapThreeDaysAgo# = #UpsideGapThreeDaysAgoPoints# points",Barindex,UpsideGapThreeDaysAgo+VOffset,SansSerif,Bold,12) COLOURED(0, 255, 0) ELSE UpsideGapThreeDaysAgo = Undefined UpsideGapThreeDaysAgoPoints = Undefined ENDIF ELSIF OpenThreeDaysAgo > CloseFourDaysAgo THEN IF LowTwoDaysAgo > CloseFourDaysAgo AND YesterdaysLow > CloseFourDaysAgo THEN DownsideGapThreeDaysAgo = CloseFourDaysAgo DownsideGapThreeDaysAgoPoints = MIN(LowThreeDaysAgo,MIN(LowTwoDaysAgo, YesterdaysLow))-CloseFourDaysAgo DRAWSEGMENT(Barindex-b,DownsideGapThreeDaysAgo,Barindex,DownsideGapThreeDaysAgo) COLOURED(255, 0, 0) DRAWTEXT("Downside gap three days ago #DownsideGapThreeDaysAgo# = #DownsideGapThreeDaysAgoPoints# points",Barindex,DownsideGapThreeDaysAgo+VOffset,SansSerif,Bold,12) COLOURED(255, 0, 0) ELSE DownsideGapThreeDaysAgo = Undefined ENDIF ENDIF ENDIF IF i = b AND GapFillTwoDaysAgo = 0 THEN IF OpenTwoDaysAgo < CloseThreeDaysAgo THEN IF YesterdaysHigh < CloseThreeDaysAgo THEN UpsideGapTwoDaysAgo = CloseThreeDaysAgo UpsideGapTwoDaysAgoPoints = CloseThreeDaysAgo-MAX(HighTwoDaysAgo,YesterdaysHigh) DRAWSEGMENT(Barindex-b,UpsideGapTwoDaysAgo,Barindex,UpsideGapTwoDaysAgo) COLOURED(0, 255, 0) DRAWTEXT("Upside gap two days ago #UpsideGapTwoDaysAgo# = #UpsideGapTwoDaysAgoPoints# points",Barindex,UpsideGapTwoDaysAgo+VOffset,SansSerif,Bold,12) COLOURED(0, 255, 0) ELSE UpsideGapTwoDaysAgo = Undefined ENDIF ELSIF OpenTwoDaysAgo > CloseThreeDaysAgo THEN IF YesterdaysLow > CloseThreeDaysAgo THEN DownsideGapTwoDaysAgo = CloseThreeDaysAgo DownsideGapTwoDaysAgoPoints = MIN(LowTwoDaysAgo,YesterdaysLow)-CloseThreeDaysAgo DRAWSEGMENT(Barindex-b,DownsideGapTwoDaysAgo,Barindex,DownsideGapTwoDaysAgo) COLOURED(255, 0, 0) DRAWTEXT("Downside gap two days ago #DownsideGapTwoDaysAgo# = #DownsideGapTwoDaysAgoPoints# points",Barindex,DownsideGapTwoDaysAgo+VOffset,SansSerif,Bold,12) COLOURED(255, 0, 0) ELSE DownsideGapTwoDaysAgo = Undefined ENDIF ENDIF ENDIF IF i = b AND GapFillYesterday = 0 THEN IF YesterdaysOpen < CloseTwoDaysAgo THEN UpsideGapYesterday = CloseTwoDaysAgo UpsideGapYesterdayPoints = CloseTwoDaysAgo-YesterdaysHigh DRAWSEGMENT(Barindex-b,UpsideGapYesterday,Barindex,UpsideGapYesterday) COLOURED(0, 255, 0) DRAWTEXT("Upside gap yesterday #UpsideGapYesterday# = #UpsideGapYesterdayPoints# points",Barindex,UpsideGapYesterday+VOffset,SansSerif,Bold,12) COLOURED(0, 255, 0) ELSIF YesterdaysOpen > CloseTwoDaysAgo THEN DownsideGapYesterday = CloseTwoDaysAgo DownsideGapYesterdayPoints = YesterdaysLow-CloseTwoDaysAgo DRAWSEGMENT(Barindex-b,DownsideGapYesterday,Barindex,DownsideGapYesterday) COLOURED(255, 0, 0) DRAWTEXT("Downside gap yesterday #DownsideGapYesterday# = #DownsideGapYesterdayPoints# points",Barindex,DownsideGapYesterday+VOffset,SansSerif,Bold,12) COLOURED(255, 0, 0) ENDIF ELSE UpsideGapYesterday = Undefined DownsideGapYesterday = Undefined ENDIF IF i = b THEN IF Open < YesterdaysClose THEN UpsideGap = YesterdaysClose UpsideGapPoints = YesterdaysClose-Open DRAWSEGMENT(Barindex-b,UpsideGap,Barindex,UpsideGap) COLOURED(0, 255, 0) DRAWTEXT("Upside gap #UpsideGap# = #UpsideGapPoints# points",Barindex,UpsideGap+VOffset,SansSerif,Bold,12) COLOURED(0, 255, 0) ELSIF Open > YesterdaysClose THEN DownsideGap = YesterdaysClose DownsideGapPoints = Open-YesterdaysClose DRAWSEGMENT(Barindex-b,DownsideGap,Barindex,DownsideGap) COLOURED(255, 0, 0) DRAWTEXT("Downside gap #DownsideGap# = #DownsideGapPoints# points",Barindex,DownsideGap+VOffset,SansSerif,Bold,12) COLOURED(255, 0, 0) ENDIF ELSE UpsideGapYesterday = Undefined DownsideGapYesterday = Undefined ENDIF RETURN // YesterdaysOpen COLOURED(255, 215, 0) STYLE(Line, 1) AS "Yesterday's Open", YesterdaysHigh COLOURED(0, 255, 0) STYLE(DottedLine, 1) AS "Yesterday's High", YesterdaysLow COLOURED(255, 0, 0) STYLE(DottedLine, 1) AS "Yesterday's Low", YesterdaysClose COLOURED(0, 0, 0) STYLE(Line, 1) AS "Yesterday's Close", OpenTwoDaysAgo COLOURED(0, 0, 0) STYLE(Line, 1) AS "Open two days ago", HighTwoDaysAgo COLOURED(0, 255, 0) STYLE(DottedLine, 2) AS "High two days ago", LowTwoDaysAgo COLOURED(255, 215, 0) STYLE(DottedLine, 2) AS "Low two days ago", CloseTwoDaysAgo COLOURED(0, 0, 0) STYLE(Line, 2) AS "Close two days ago", OpenThreeDaysAgo COLOURED(255, 215, 0) STYLE(Line, 1) AS "Open three days ago", HighThreeDaysAgo COLOURED(0, 255, 0) STYLE(DottedLine, 2) AS "High three days ago", LowThreeDaysAgo COLOURED(255, 0, 0) STYLE(DottedLine, 2) AS "Low three days ago", CloseThreeDaysAgo COLOURED(0, 0, 0) STYLE(Line, 2) AS "Close three days ago", OpenFourDaysAgo COLOURED(255, 215, 0) STYLE(Line, 1) AS "Open four days ago", HighFourDaysAgo COLOURED(0, 255, 0) STYLE(DottedLine, 2) AS "High four days ago", LowFourDaysAgo COLOURED(255, 0, 0) STYLE(DottedLine, 2) AS "Low four days ago", CloseFourDaysAgo COLOURED(0, 0, 0) STYLE(Line, 2) AS "Close four days ago"// , TodaysOpen COLOURED(255, 255, 0) AS "Today's Open", Stoploss COLOURED(255, 0, 0) AS "Stop loss (for longs)" |
Share this
No information on this site is investment advice or a solicitation to buy or sell any financial instrument. Past performance is not indicative of future results. Trading may expose you to risk of loss greater than your deposits and is only suitable for experienced investors who have sufficient financial means to bear such risk.
ProRealTime ITF files and other attachments :PRC is also on YouTube, subscribe to our channel for exclusive content and tutorials

Thank you but I don’t really understand. The values don’t fit with what I see on my chart. I don’t understand why I see at the opening an upside and downside gap.