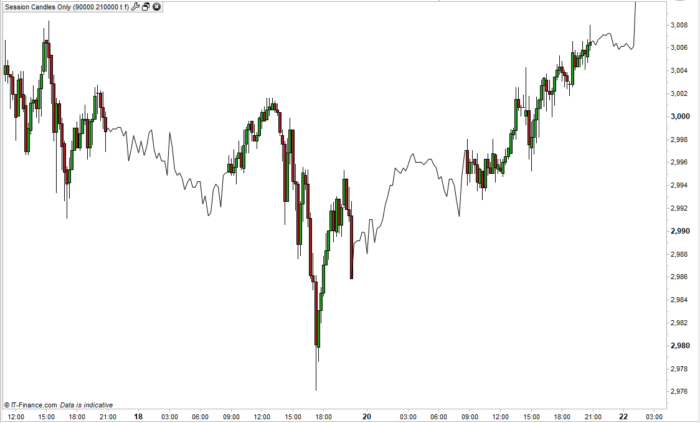
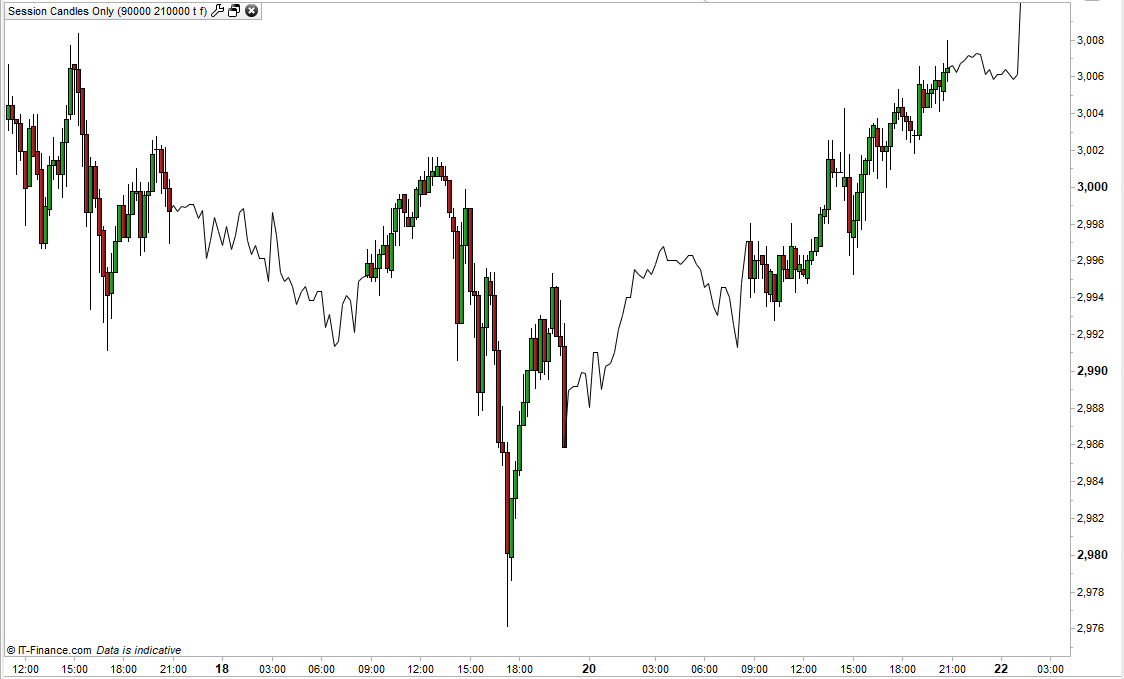
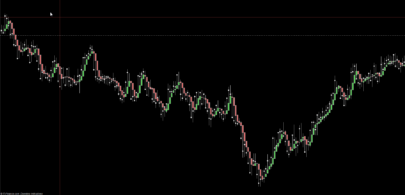
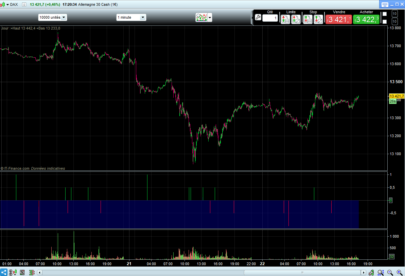
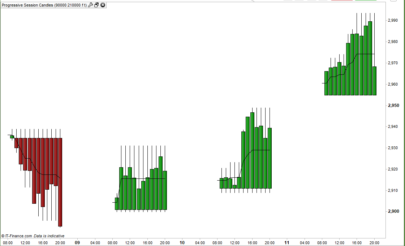
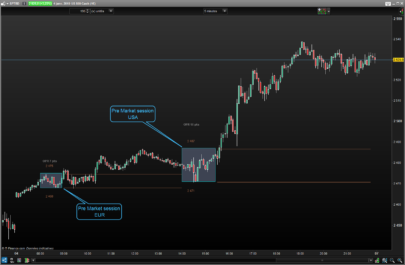
This simple indicator allows you to display candles only if they are between set times. This allows you to remove any out of trading hours candles to make the chart clearer.
You have the option to leave the out of session space on the chart blank or to draw a line connecting the closing prices.
You can also display the out of session candles if you want to. Tick or untick OOHLine and OOHCandles to change the display.
Set the StartTime and EndTime variables to your desired trading session hours start and end times.
As always I advise downloading the ITF file and importing it to ensure full functionality.
|
1 2 3 4 5 6 7 8 9 10 11 12 13 14 15 16 17 18 19 20 21 22 23 24 25 26 27 28 29 30 |
//Session Candles Only //By Vonasi //20191022 //starttime = 090000 //endtime = 210000 r = 128 g = 0 if close > open then r = 0 g = 128 endif if opentime >= starttime and opentime <= endtime then if opentime = starttime and oohline and not oohcandles then drawsegment(barindex,open,barindex-1,close[1]) COLOURED(0,0,0) endif drawcandle(open,high,low,close) COLOURED(R,G,0) BORDERCOLOR(0,0,0) else if oohline and not oohcandles then drawsegment(barindex,close,barindex-1,close[1]) COLOURED(0,0,0) else if oohcandles then drawcandle(open,high,low,close) COLOURED(R,G,0) BORDERCOLOR(0,0,0) endif endif endif return |
Share this
No information on this site is investment advice or a solicitation to buy or sell any financial instrument. Past performance is not indicative of future results. Trading may expose you to risk of loss greater than your deposits and is only suitable for experienced investors who have sufficient financial means to bear such risk.
ProRealTime ITF files and other attachments :PRC is also on YouTube, subscribe to our channel for exclusive content and tutorials





Awesome. Thank you.