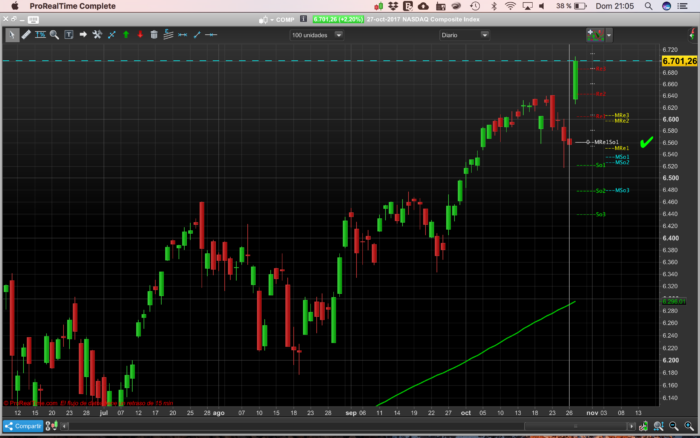
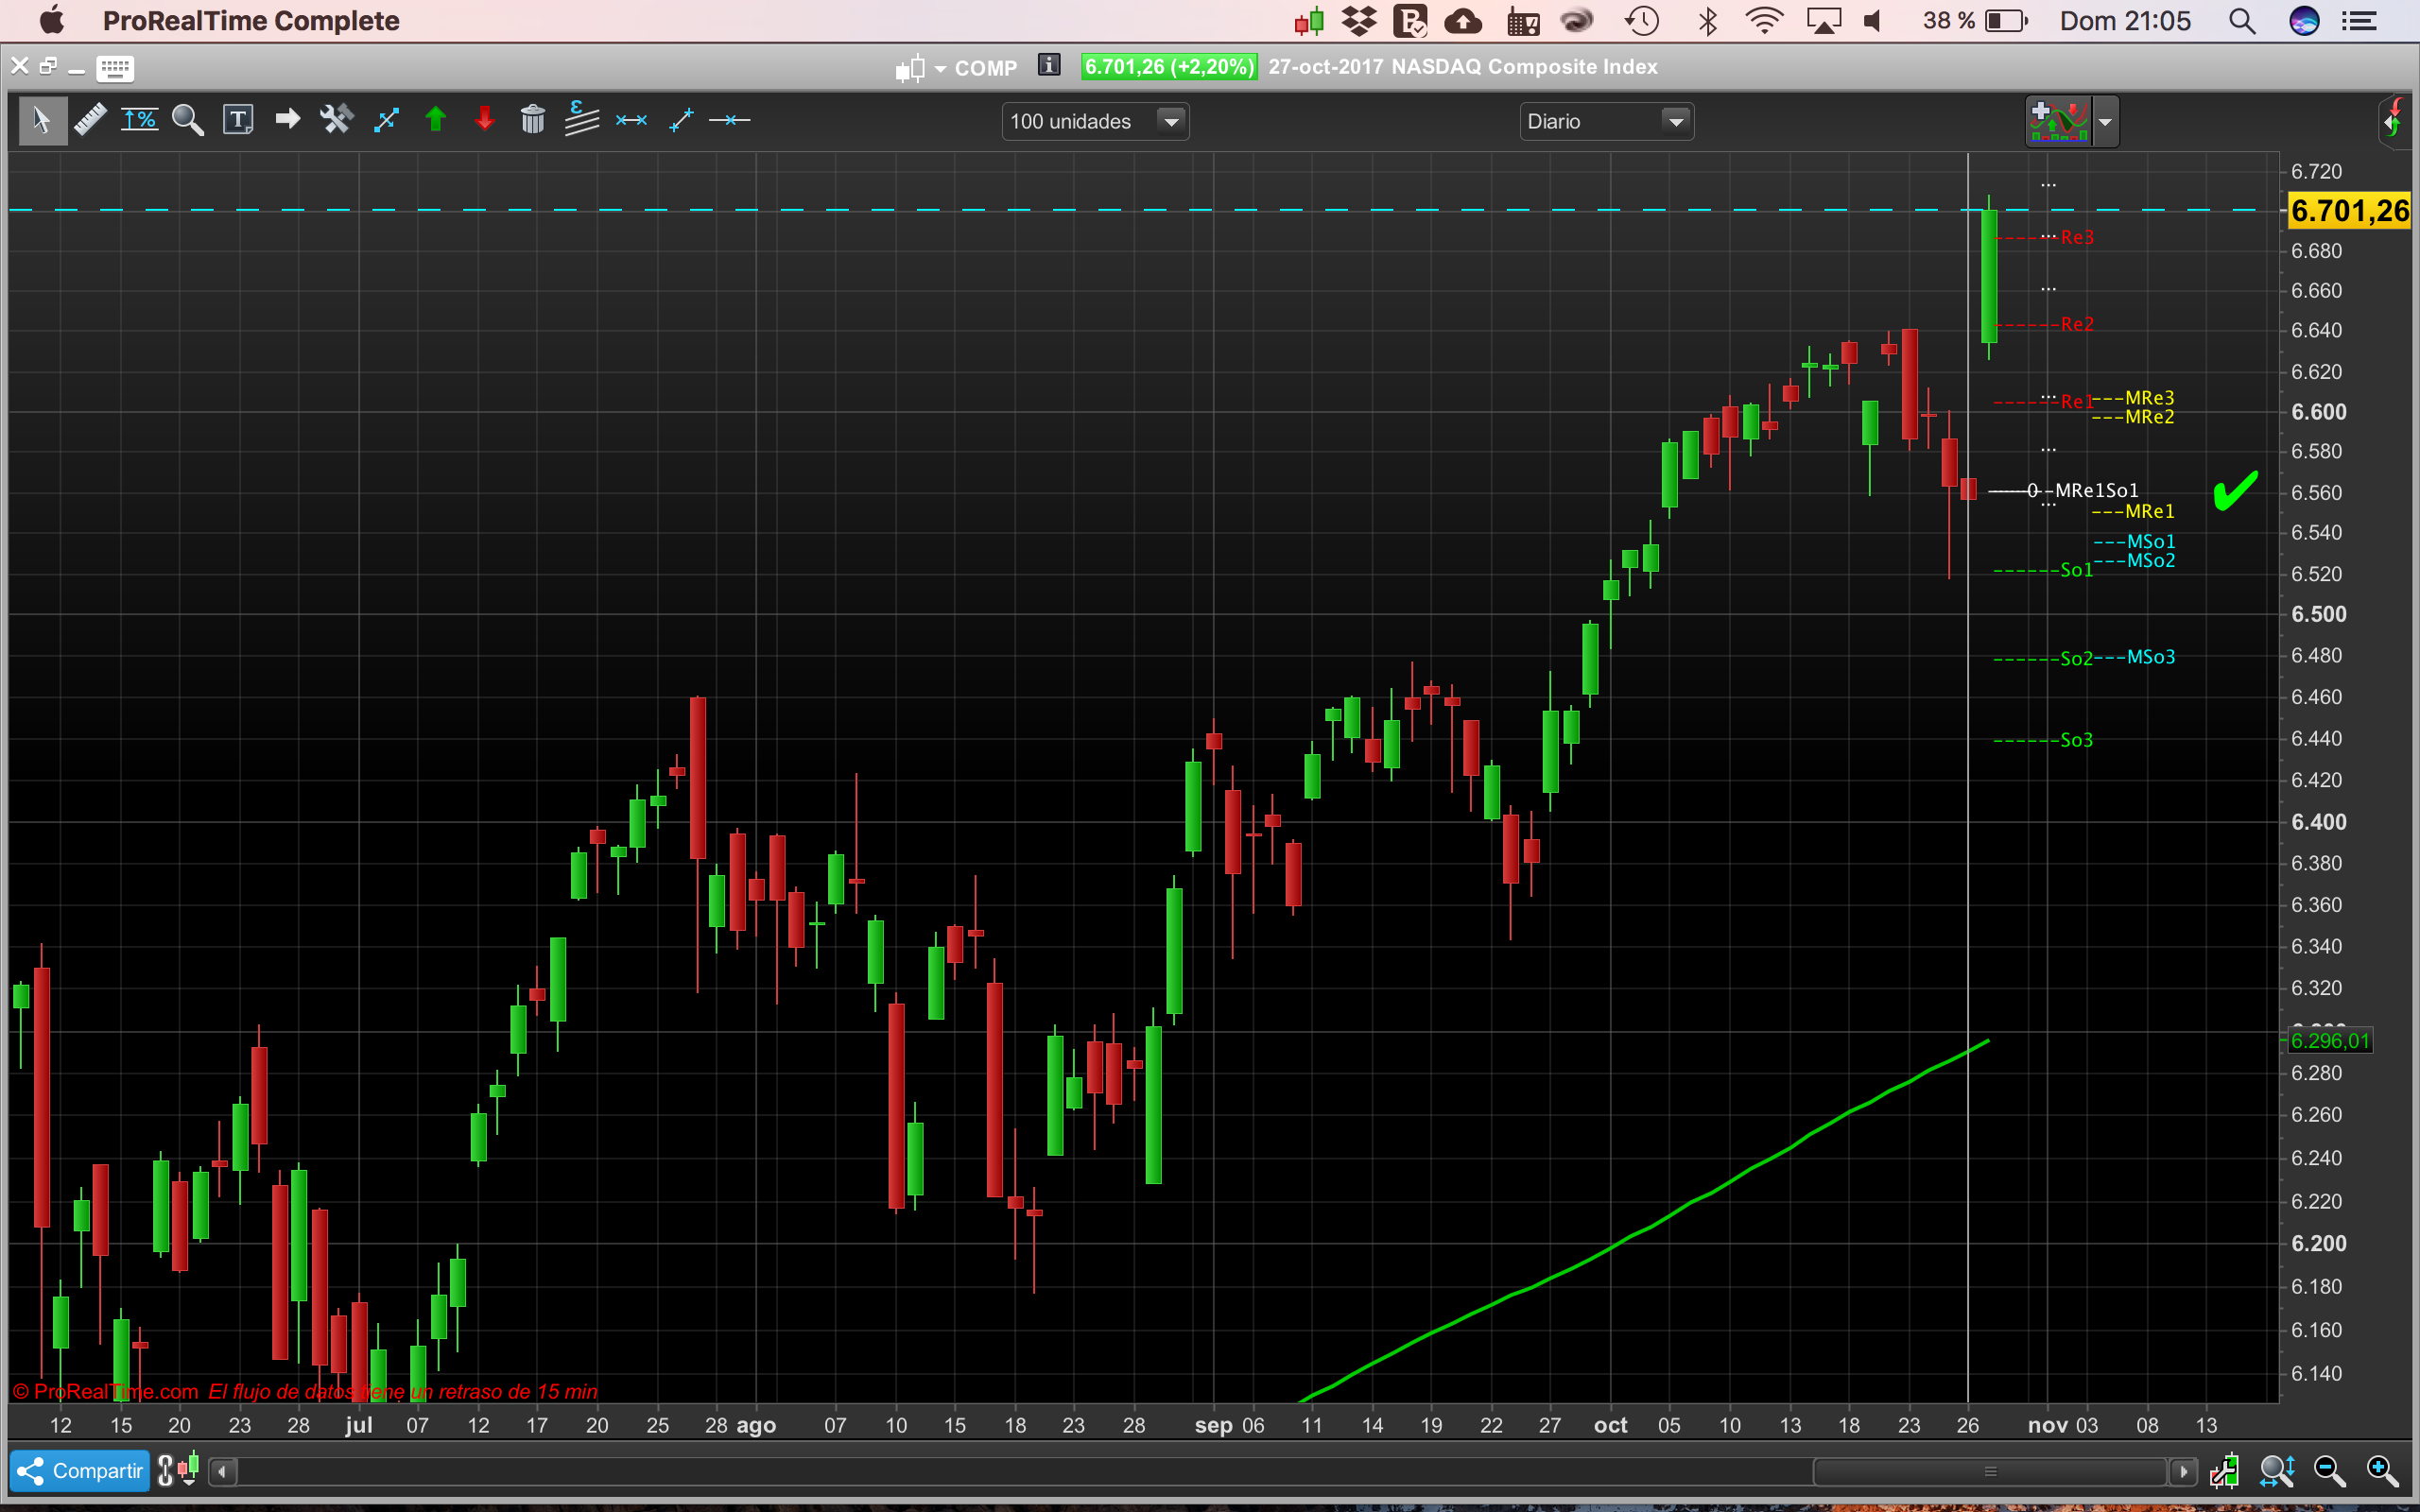
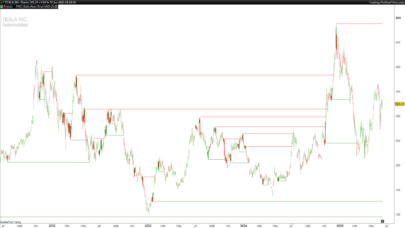
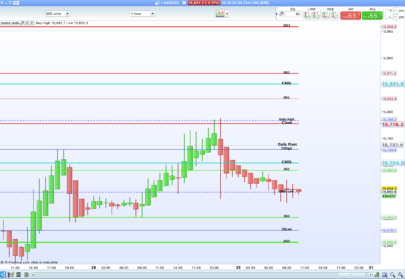
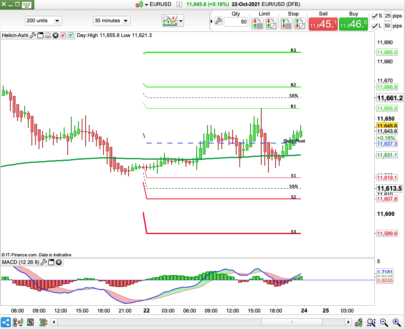
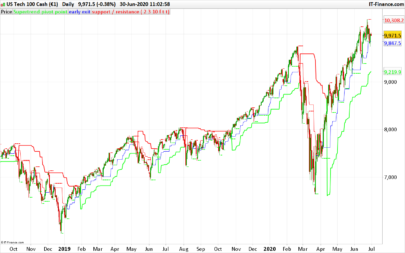
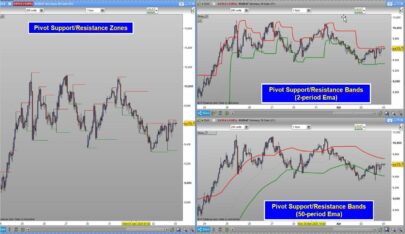
Today I want to share with you this indicator that has already been created for a long time and that is based on Pivot points. I’m not going to explain how it works because I have it in disuse and I do not remember how it worked exactly but it may be that someone is useful.
“Dedicate your energies to the creation of good indicators, instead of trying to predict the movement of the market, and that way you can get to survive”
APPEL, GERALD
Hoy quiero compartir con ustedes este indicador que ya cree hace tiempo y que esta basado en los puntos Pivote. No os voy a explicar como funciona porque lo tengo en desuso y ya no me acuerdo como funcionaba exactamente pero puede que a alguien le sea de utilidad.
“Dedica tus energías a la creación de unos buenos indicadores, en vez de intentar predecir el movimiento del mercado, y de esa forma podrás conseguir sobrevivir”
APPEL, GERALD
|
1 2 3 4 5 6 7 8 9 10 11 12 13 14 15 16 17 18 19 20 21 22 23 24 25 26 27 28 29 30 31 32 33 34 35 36 37 38 39 40 41 42 43 44 45 46 47 48 49 50 51 52 53 54 55 56 57 58 59 60 61 62 63 64 65 66 67 68 69 70 71 72 73 74 75 76 77 78 79 80 81 82 83 84 85 86 87 88 89 90 91 92 93 94 95 96 97 98 99 100 101 102 103 104 105 106 107 108 109 110 111 112 113 114 115 116 117 118 119 120 121 122 123 124 125 126 127 128 129 130 131 132 133 134 135 136 137 138 139 140 141 142 143 144 145 |
//---settings //Rewind = 0 //ConstantePrecio = 1 //(1=weightedclose 2=Totalprice 3=Typicalprice 4=Medianprice) //LineAnalisis=1 //--- Defparam DRAWONLASTBARONLY = True If ConstantePrecio = 1 then Price = Weightedclose elsif ConstantePrecio = 2 then Price = Totalprice elsif ConstantePrecio = 3 then Price = Typicalprice elsif ConstantePrecio = 4 then Price = Medianprice elsif ConstantePrecio = 5 then Price = close else Price = Typicalprice endif If LineAnalisis = 1 then DRAWVLINE(barindex[1+Rewind]) coloured (160,160,160) else endif pp = price[1+Rewind] MRe1 = (pp + Re1) / 2 Re1 = pp + (pp - Low[2+Rewind]) MRe2 = (Re1 + Re2) / 2 Re2 = pp + (High[2+Rewind] - Low[2+Rewind]) MRe3 = (Re2 + Re3) / 2 Re3 = High[2+Rewind] + 2*(pp - Low[2+Rewind]) MRe1So1=pp + (pp - price[2+Rewind]) MSo1 = (pp + So1) / 2 So1 = pp - (High[2+Rewind] - pp) MSo2 = (So1 + So2) / 2 So2 = pp - (high[2+Rewind] - Low[2+Rewind]) MSo3 = (So2 + So3) / 2 So3 = Low[2+Rewind] - 2*(high[2+Rewind] - pp) //========================================================== DRAWTEXT(" ···", barindex, (open + (open*0.004))) DRAWTEXT(" ···", barindex, (open + (open*0.008))) DRAWTEXT(" ···", barindex, (open + (open*0.012))) // DRAWTEXT(" ···", barindex, (open - (open*0.004))) DRAWTEXT(" ···", barindex, (open - (open*0.008))) DRAWTEXT(" ···", barindex, (open - (open*0.012))) //=========================================================== //DRAWSEGMENT(barindex[1], pp, barindex[0], pp) DRAWTEXT(" ---0", barindex, pp) //DRAWSEGMENT(barindex, MRe1So1, barindex[1], MRe1So1) DRAWTEXT(" ------MRe1So1", barindex, MRe1So1) //DRAWSEGMENT(barindex, open, barindex[1], open) //DRAWTEXT(" ------Open", barindex, open) //DRAWSEGMENT(barindex, MRe1, barindex[1], Mre1) coloured (102,102,102) DRAWTEXT(" ---MRe1", barindex, MRe1) coloured (255,255,0) //DRAWSEGMENT(barindex, Re1, barindex[1], Re1) coloured (255,0,0) DRAWTEXT(" ------Re1", barindex, re1) coloured (255,0,0) //DRAWSEGMENT(barindex, MRe2, barindex[1], Mre2) coloured (102,102,102) DRAWTEXT(" ---MRe2", barindex, MRe2) coloured (255,255,0) //DRAWSEGMENT(barindex, Re2, barindex[1], Re2)coloured (255,0,0) DRAWTEXT(" ------Re2", barindex, re2)coloured (255,0,0) //DRAWSEGMENT(barindex, MRe3, barindex[1], MRe3) coloured (102,102,102) DRAWTEXT(" ---MRe3", barindex, MRe3) coloured (255,255,0) //DRAWSEGMENT(barindex, Re3, barindex[1], Re3)coloured (255,0,0) DRAWTEXT(" ------Re3", barindex, re3)coloured (255,0,0) //DRAWSEGMENT(barindex, MSo1, barindex[1], MSo1) coloured (102,102,102) DRAWTEXT(" ---MSo1", barindex, MSo1) coloured (0,255,255) //DRAWSEGMENT(barindex, So1, barindex[1], So1)coloured (0,255,0) DRAWTEXT(" ------So1", barindex, So1)coloured (0,255,0) //DRAWSEGMENT(barindex, MSo2, barindex[1], MSo2) coloured (102,102,102) DRAWTEXT(" ---MSo2", barindex, MSo2) coloured (0,255,255) //DRAWSEGMENT(barindex, So2, barindex[1], So2)coloured (0,255,0) DRAWTEXT(" ------So2", barindex, So2)coloured (0,255,0) //DRAWSEGMENT(barindex, MSo3, barindex[1], MSo3) coloured (102,102,102) DRAWTEXT(" ---MSo3", barindex, MSo3) coloured (0,255,255) //DRAWSEGMENT(barindex, So3, barindex[1], So3)coloured (0,255,0) DRAWTEXT(" ------So3", barindex, So3)coloured (0,255,0) //X = 12 //If close[1+Rewind] > highest[3+Rewind](high[2+Rewind]) then //DRAWTEXT("⊼", barindex[x], low,Dialog,Standard,30) coloured (0,255,0) //DRAWELLIPSE(barindex[x-1], low+(low*0.002), barindex[x+1], low-(low*0.002)) coloured (102,102,102) //elsif close[1+Rewind] < lowest[3+Rewind](low[2+Rewind]) then //DRAWTEXT("⊻", barindex[x], High,Dialog,Standard,30) coloured (255,0,0) //DRAWELLIPSE(barindex[x-1], high-(high*0.002), barindex[x+1], high+(high*0.0015)) coloured (102,102,102) //else //DRAWTEXT("⇅", barindex[10], close,Dialog,Standard,15) coloured (0,255,255) //DRAWTEXT("⊼", barindex[x], low,Dialog,Standard,30) coloured (0,255,0) //DRAWTEXT("⊻", barindex[x], High,Dialog,Standard,30) coloured (255,0,0) //DRAWELLIPSE(barindex[x-1], low+(low*0.002), barindex[x+1], low-(low*0.002)) coloured (102,102,102) //DRAWELLIPSE(barindex[x-1], high-(high*0.002), barindex[x+1], high+(high*0.0015)) coloured (102,102,102) //endif If Re1 > MRE1So1 and Re2 > Re1 and Re3 > Re2 And So1 < Mre1so1 and so2 < so1 and so3 < so2 then DRAWTEXT(" ✔", barindex, MRe1So1,Dialog,Standard,30) coloured (0,255,0) else DRAWTEXT(" ✗", barindex, MRe1So1,Dialog,Standard,30) coloured (255,0,0) endif return //(0, 0, 0)negro ⁉ ⇡ ⇣ ⁈ ⁈ //(255, 255, 255)blanco //(255, 0, 0)rojo //(0, 255, 0)verde //(0, 0, 255)azul //(255, 255, 0)amarillo //(0, 255, 255)azul celeste //(255, 0, 255)añil |
Share this
No information on this site is investment advice or a solicitation to buy or sell any financial instrument. Past performance is not indicative of future results. Trading may expose you to risk of loss greater than your deposits and is only suitable for experienced investors who have sufficient financial means to bear such risk.
ProRealTime ITF files and other attachments :PRC is also on YouTube, subscribe to our channel for exclusive content and tutorials



Nicolas
Est-il possible que tu nous donne un éclairage sur cet indicateur ?
le zero ne se trouve pas entre les supports et résistances ?
les verts/rouges sont des pivots journaliers,hebdo ?
les jaunes/bleus sont des hebdo,mensuels ?
l’auteur ne nous dit rien du fonctionnement de l’indicateur pourtant c’est un pro qui vends des cours dans la planète latine, ne serait ce que de la pub déguisée ?
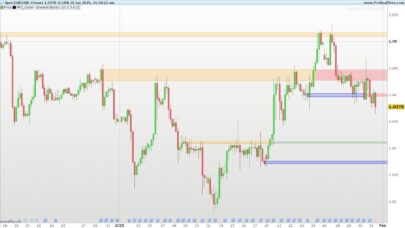
Quisiera aclarar que no soy un profesional ni vendo cursos, ni es publicidad disfrazada. verde rojo son pivotes cotidianos calculados con la constanteprecio elegida. amarillo azul corresponde a los centros de los verdes rojos , segun la formula aunque en la representacion salen donde les da la gana y la x y la verificacion corresponde a divergencias entre los verdes rojos
Para calcular el punto pivote y los niveles de soporte y resistencia para operar durante la siguiente sesión, se requieren el high (alto), low (bajo) y close (cierre)del día anterior. El punto pivote es simplemente el promedio del high más el low más el close, o (H + L + C)/3. El nivel del soporte 1 es calculado multiplicando el Pivote por 2 y luego sustrayendo el high del día anterior. El nivel de resistencia 1 es calculado multiplicando el Pivote por 2 y luego sustrayendo el low del día anterior. El soporte secundario (S2) y el nivel de resistencia (R2) son calculados usando los números (P, S1 y R1). Y finalmente el soporte 3 (S3) y la resistencia 3 (R3) son calculados usando los números (P, H, L). Estos son los cálculos:
Resistencia 2 (R2) = P + (H – L)
Resistencia 1 (R1) = P + (P – L)
PP (P) = (H + L + C) / 3
Soporte 1 (S1) = PP – (H – P)
Soporte 2 (S2) = P – (H – L)
Existen variaciones de la fórmula, en las que los niveles de Soporte y Resistencia se calculan de diferente manera, variando ligeramente los resultados. Estas son algunas:
Resistencia 2 (R2) = P + (R1 – S1)
Resistencia 1 (R1) = (P * 2) – L
Punto Pivote (P) = (H + L + C) / 3
Soporte 1 (S1) = (P * 2) – H
Soporte 2 (S2) = P– (R1 – S1)
Resistencia 2 (R2) = P – (S1 + R1)
Resistencia 1 (R1) = (2*P) – L
PP (P) = (H + L + C) / 3
Soporte 1 (S1) = (2*P) – H
Soporte 2 (S2) = P – (R1 + S1)
Hay ciertas plataformas que calculan también los niveles (S3) y (R3), útiles en días de gran volatividad, u otras que calculan los niveles intermediarios, denominados (M), que también que aportan información adicional al calculo básico. Estos últimos son útiles después de un día con una gran volatilidad, ya que los Puntos Pivote quedan muy distanciados entre sí.
Resistencia 3 (R3) = H + 2 X (P – L)
Resistencia 2 (R2) = P + H – L
Resistencia 1 (R1) = (2 X P) – L
PP (P) = (H + L + C) / 3
Soporte 1 (S1) = (2 X P) – H
Soporte 2 (S2) = P – H + L
Soporte 3 (S3) = L – 2 X (H – P)
Variantes de los puntos pivote
Hola
mis disculpas, creia que tu eres Jose Antonio Madrigal !
gracias por las explicaciones
un saludo
espero que las explicaciones te hayan sido de ayuda
saludos