
In the world of trading, identifying market sideways phases is crucial for adjusting investment strategies and minimizing risks. These phases, known as “Sideways” periods, are characterized by the absence of a clear trend, where prices fluctuate within a relatively narrow range without showing a defined direction. During these periods, trend-oriented strategies often lose effectiveness, making it necessary to use tools that help detect and capitalize on these market consolidation moments.
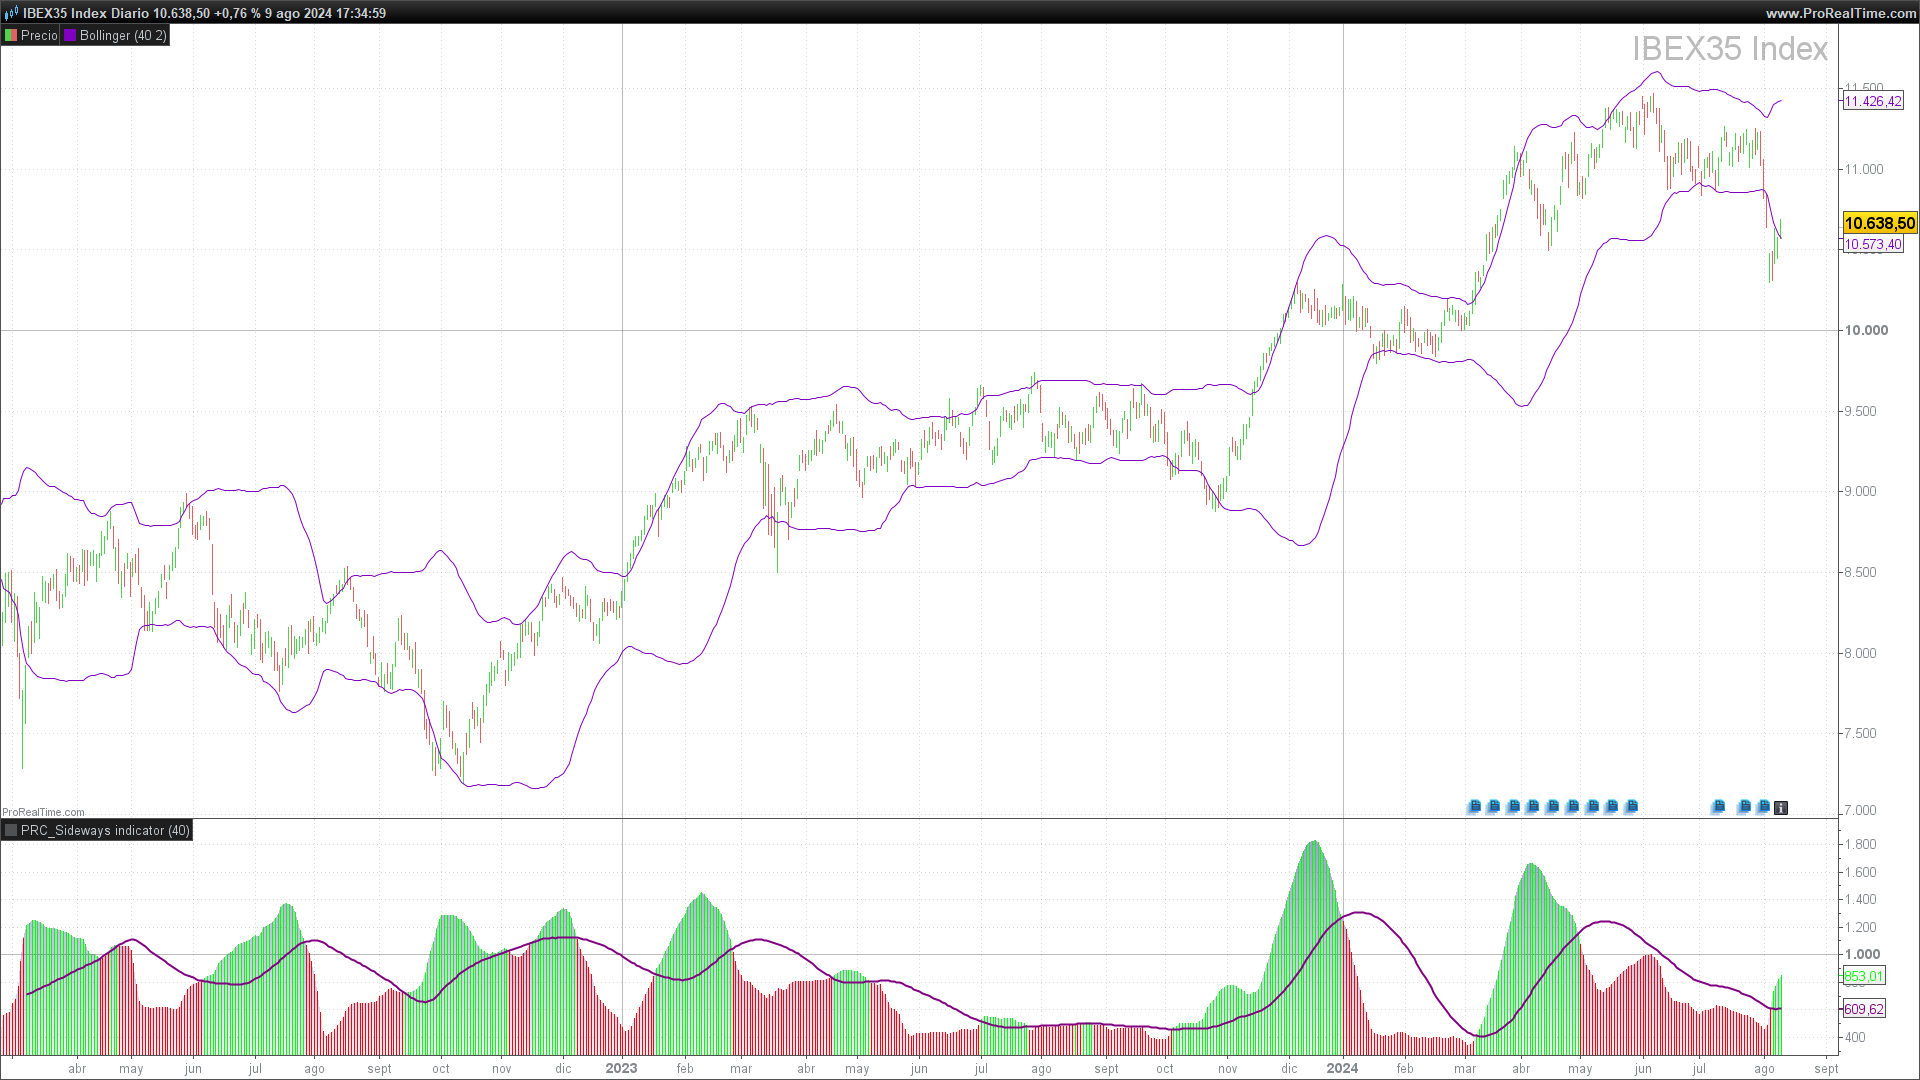
The Sideways indicator, which uses a combination of Bollinger Bands and Momentum measurement, is specifically designed to identify these sideways periods. By measuring the contraction or expansion of the Bollinger Bands and comparing it to their average, this indicator provides a clear and simple visualization of market volatility, helping traders detect possible consolidation phases and make more informed decisions.
Description of the Sideways Indicator
The Sideways indicator is a technical tool designed to identify periods when the market moves sideways, meaning without a clear upward or downward trend. This type of movement is common in financial markets and can be challenging for traders who use trend-based strategies.
The Sideways indicator combines two fundamental components of technical analysis:
- Bollinger Bands: Bollinger Bands are a volatility indicator consisting of a simple moving average and two standard deviations above and below that average. These bands expand and contract based on market volatility. In the Sideways indicator, they are used to measure the distance between the upper and lower bands, which provides an indication of current volatility.
- Momentum: Momentum is calculated as the difference between the upper and lower Bollinger Bands. Lower momentum indicates that the bands are closer together, suggesting a phase of low volatility and possible sideways movement. Conversely, higher momentum indicates an expansion of the bands, which may signal an increase in volatility and the possibility that the market is emerging from a sideways phase.
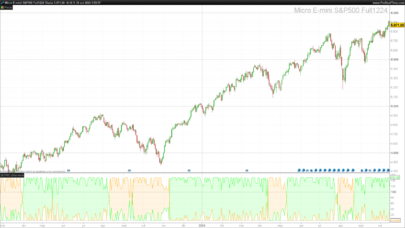
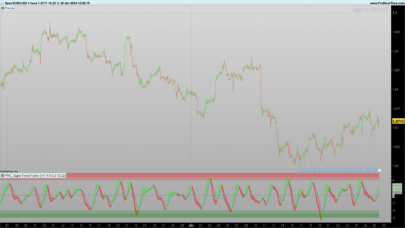
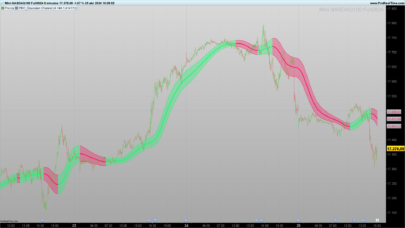
The Sideways indicator is visualized through a histogram, where positive and negative values are colored based on their relationship with the momentum moving average. This allows traders to quickly identify when the market is entering or exiting a sideways phase.
Calculation of the Indicator
The Sideways indicator is based on a series of technical calculations that combine Bollinger Bands with a measure of market momentum. Below are the key steps in its calculation:
1. Calculation of Bollinger Bands
Bollinger Bands are the first essential component of the indicator. These bands are calculated using a simple moving average and the standard deviation of prices. In the case of the Sideways indicator, a moving average length defined by the MALength parameter, which is set to 40 periods by default, is used.
- Upper Band (BolUpper):
BolUpper=BollingerUp[MALength](Close)
This formula calculates the upper band by adding two standard deviations to the value of the moving average of the closing prices.
- Lower Band (BolLower):
BolLower=BollingerDown[MALength](Close)
Similarly, the lower band is calculated by subtracting two standard deviations from the value of the moving average of the closing prices.
2. Calculation of Momentum
Market momentum, in this context, is defined as the difference between the upper and lower Bollinger Bands:
Moment=BolUpper−BolLower
This momentum value reflects the current market volatility. A low momentum value indicates that the bands are closer together, suggesting a phase of low volatility and possible sideways movement. A high value indicates an expansion of the bands, signaling an increase in volatility.
3. Simple Moving Average of Momentum
To smooth out momentum values and facilitate the identification of trends in volatility, a simple moving average is applied to the calculated momentum value:
MomentLine=Average[MALength](Moment)
This momentum average line acts as a reference threshold to determine whether volatility is increasing or decreasing relative to its recent average.
4. Histogram Color Definition
The histogram’s color is determined by comparing the current momentum value with the momentum moving average line:
- If momentum is greater than or equal to the moving average (Moment >= MomentLine), the histogram is colored green, indicating a possible expansion in volatility.
- If momentum is less than the moving average (Moment < MomentLine), the histogram is colored red, suggesting a possible contraction in volatility.
Interpretation of the Indicator
The Sideways indicator offers a visual representation of market volatility through a colored histogram and a momentum moving average line. The following details how to interpret the signals provided by this indicator:
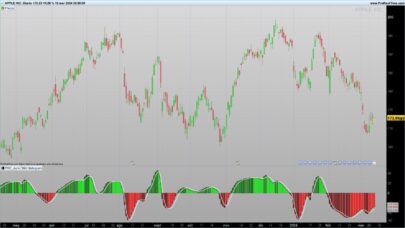
1. The Momentum Histogram
The histogram is the main component of the Sideways indicator and represents the difference between the Bollinger Bands (Momentum). This histogram changes color based on the relationship between the current momentum and its moving average. The key interpretations are:
- Green Histogram: When the current momentum (Moment) is equal to or higher than the momentum moving average line (MomentLine), the histogram is colored green. This indicates an expansion in market volatility, which could signal the end of a sideways period and the beginning of a new trend, either upward or downward. In such cases, traders should be prepared for potential breakouts in the price range.
- Red Histogram: When the current momentum is lower than the momentum moving average, the histogram is colored red. This suggests a contraction in volatility, which is usually indicative of a consolidating or sideways market. In this scenario, prices may remain within a narrow range without a clear direction, and traders might opt for strategies that benefit from a lack of trend, such as selling options or range-bound strategies.
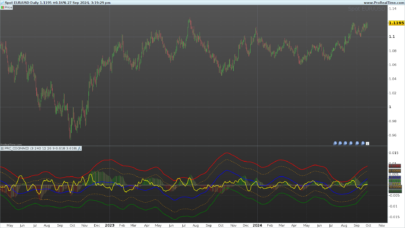
2. The Momentum Moving Average Line (MomentLine)
The momentum moving average line acts as a dynamic threshold that helps traders differentiate between phases of expanding and contracting volatility:
- Above the MomentLine: If the histogram is above the MomentLine, it suggests that the market is experiencing increasing volatility, which could anticipate a change in price direction or a breakout from a sideways range.
- Below the MomentLine: If the histogram is below the MomentLine, it suggests that the market is experiencing decreasing volatility, reinforcing the idea that the market may be in a sideways phase.
Practical Examples
To better understand how to use the Sideways indicator, consider the following scenarios:
- Volatility Expansion Scenario: Suppose the market has been in a narrow range for several sessions, and suddenly, the Sideways indicator histogram starts to turn green, crossing above the MomentLine. This may be a signal that the market is about to break out of the range, offering an opportunity to trade in the direction of the breakout.
- Volatility Contraction Scenario: In another case, after a strong price movement, the Sideways histogram turns red and falls below the MomentLine. This could indicate that the market is entering a consolidation phase, suggesting that trend-based trading strategies may not be effective at this time.
Indicator Configuration
The Sideways indicator allows some flexibility in its configuration to adapt to different market conditions and trading styles. Below are the key parameters that can be adjusted and how they affect the indicator’s behavior:
1. Moving Average Length (MALength)
- Parameter: MALength
- Default value: 40
- Description: This parameter defines the number of periods used to calculate the simple moving average applied to both the Bollinger Bands and the momentum. By modifying the moving average length, you can adjust the indicator’s sensitivity to changes in volatility.
- Longer Length: Increasing the MALength value will make the moving average, and therefore the indicator overall, less sensitive to short-term fluctuations, smoothing the histogram. This is useful in markets with erratic movements, where a more stable and reliable signal for volatility changes is desired.
- Shorter Length: Reducing the MALength value increases the indicator’s sensitivity, making it more responsive to rapid changes in volatility. This adjustment is more suitable for markets where trends change quickly and the trader wants to capture early volatility movements.
2. Histogram Color Adjustment
Although the predefined colors for the histogram are green for volatility expansion and red for contraction, these colors can be modified in the code to suit user preferences.
- Green Histogram (Expansion):
- r=0, g=255, b=0 (Default value, green)
- Red Histogram (Contraction):
- r=255, g=0, b=0 (Default value, red)
Changing these values allows you to customize the indicator’s appearance on the chart, facilitating integration with other indicators that the trader may be using.
3. Application in Different Timeframes
The Sideways indicator is versatile and can be applied across various timeframes, from intraday charts to long-term charts. However, it is important to adjust the MALength parameter according to the timeframe:
- Intraday Charts (5 min, 15 min, etc.): For shorter periods, it is recommended to reduce the MALength to better capture the rapid changes in volatility that are common in these timeframes.
- Daily or Weekly Charts: In longer timeframes, a higher MALength can be more effective in identifying prolonged sideways periods or significant volatility expansions.
4. Configuration Recommendations
- High Volatility Markets: Use a shorter MALength to capture rapid expansions and contractions in volatility.
- Stable or Low Volatility Markets: A longer MALength for more stable signals and to avoid market noise.
Conclusion
The Sideways indicator is a valuable tool for traders who want to identify periods of market lateralization and adjust their strategies accordingly. By combining Bollinger Bands with momentum measurement, the indicator offers a clear representation of market volatility, helping traders anticipate possible breakouts from sideways ranges or prolonged consolidations.
The flexibility of the indicator, through the adjustment of the MALength parameter, allows it to be adapted to different timeframes and market conditions, making it a useful component in any trading strategy. Additionally, the colored histogram visualization facilitates quick interpretation of market conditions, enabling traders to make informed decisions in real time.
Final Tips
- Complement with Other Indicators: Although the Sideways indicator is effective in identifying lateralization phases, its predictive power can be enhanced when used in combination with other indicators, such as oscillators or volume indicators, to confirm signals.
- Adaptability: Experimenting with different MALength settings according to the specific asset and timeframe can significantly improve the indicator’s effectiveness.
- Caution in Volatile Markets: In highly volatile markets, it is recommended to use more sensitive settings to capture rapid changes, but always with a careful approach to avoid false signals.
Using the Sideways indicator with a clear understanding of its fundamentals and configurations can provide traders with a crucial edge in identifying market movements that might otherwise go unnoticed.
|
1 2 3 4 5 6 7 8 9 10 11 12 13 14 15 16 17 18 19 20 21 22 23 24 25 26 27 28 29 30 |
//----------------------------------------------------// //PRC_Sideways indicator (Bollinger Momentum) //version = 0 //02.05.24 //Iván González @ www.prorealcode.com //Sharing ProRealTime knowledge //----------------------------------------------------// //-----Inputs-----------------------------------------// MALength = 40 //----------------------------------------------------// //-----Bollinger bands calcultation-------------------// BolUpper = BollingerUp[MALength](close) BolLower = BollingerDown[MALength](close) //----------------------------------------------------// //-----Momentum calculation---------------------------// Moment = BolUpper - BolLower //----------------------------------------------------// //-----Simple Moving average (momentum)---------------// MomentLine = Average[MALength](Moment) //----------------------------------------------------// //-----Histogram Colour definition--------------------// if Moment >= MomentLine then r=0 g=255 else r=255 g=0 endif //----------------------------------------------------// return Moment As "Momento" coloured(r,g,0)style(histogram), MomentLine as "Avg Momento" coloured("purple")style(line,2) |
Share this
No information on this site is investment advice or a solicitation to buy or sell any financial instrument. Past performance is not indicative of future results. Trading may expose you to risk of loss greater than your deposits and is only suitable for experienced investors who have sufficient financial means to bear such risk.
ProRealTime ITF files and other attachments :
Find other exclusive trading pro-tools on ![]()
PRC is also on YouTube, subscribe to our channel for exclusive content and tutorials
Bonjour Yvan,
Merci pour ton indicateur que je trouve très intéressant.
Je suppose que tu l’as tester sur différents instruments et différentes périodes : peux-tu me préciser sur quelles périodes cet indicateur s’est révéler le plus efficace?
Merci
Hier eine kleine Korrektur:
//—–Inputs—————————————–//
MALength = Periode //Periode als Variable eingefügt