Hi all,
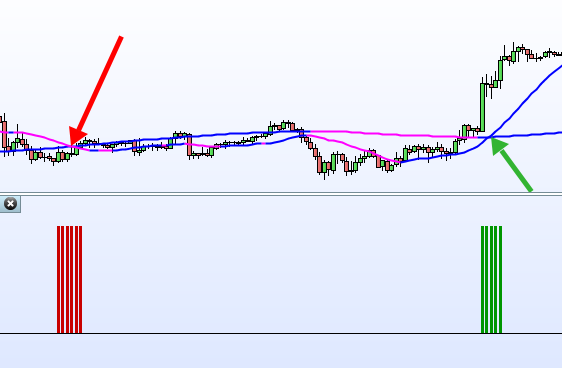
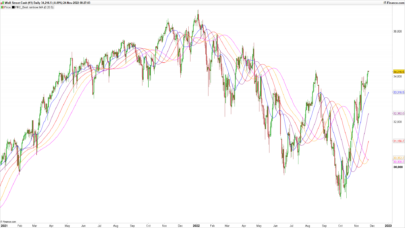
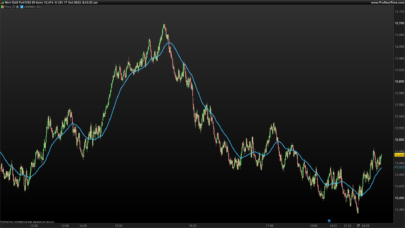
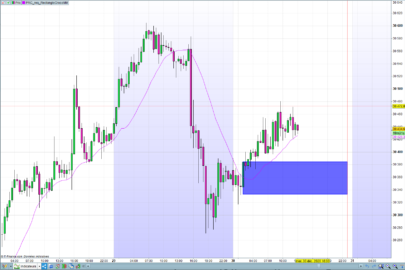
I create and indicator that highlighted the moment previous to a crossing SMA and the moment afterwards. What is called “Golden Cross” and “Death Cross”
The indicator is very simple but an be very usefully for an automatic strategy. Because it shows in real time the moment where is inevitable the crossing of two Simple Moving Average and the moment afterwards.
How it can be used? well I can imagine an strategy using it as a filter for Higher Time Frame or multi crossing of SMA in different time frame.
Hope you like it.
|
1 2 3 4 5 6 7 8 9 10 11 12 13 14 15 16 17 18 |
period001 = 50 period = 100 WMA001=weightedaverage[period001](close) WwMA001=weightedaverage[period001](WMA001) SMA002=average[period002](close) //Crossing areas definiton CrossingBULL=0 IF WMA001 > SMA002 and WwMA001 < SMA002 then CrossingBULL=1 ENDIF CrossingBEAR=0 IF WMA001 < SMA002 and WwMA001 > SMA002 then CrossingBEAR=1 ENDIF Return CrossingBULL COLOURED(0,150,0) STYLE(histogram,2) as "Crossing Bull", CrossingBEAR COLOURED(200,0,0) STYLE(histogram,2) as "Crossing Bear", 0 as "cero" |
Share this
No information on this site is investment advice or a solicitation to buy or sell any financial instrument. Past performance is not indicative of future results. Trading may expose you to risk of loss greater than your deposits and is only suitable for experienced investors who have sufficient financial means to bear such risk.
ProRealTime ITF files and other attachments :PRC is also on YouTube, subscribe to our channel for exclusive content and tutorials






Hi Leo
Line 2 period = 100 // => period002 right ?
Yeah. Inputs are period001 and period002. Strange… I think the post were edited. Anyway
i think must check the code
Period001 and period002 are the inputs of the variables. When I update the code the fisrt two lines where not there. so you can delete them or directly import the ITF file.
By the way I create a very interesting strategy that look very nice even in walkforward test ( just tested in AUD/USD in 5min timeframe)
DEFPARAM PRELOADBARS=1000
//Period001= //from 10 to 40 step 10
//Period002= //from 120 to 300 step 30
//Period003= //from 10 to 40 step 10
//Period004= //from 120 to 300 step 30
//Pentry= // from 7 to 28 step 7
//Kp= //from 1 to 2 step 0.5
WMA001=weightedaverage[period001](close)
WwMA001=weightedaverage[period001](WMA001)
SMA002=average[period002](close)
//Crossing areas definiton
CrossingBULL1=0
IF WMA001 > SMA002 and WwMA001 < SMA002 then
CrossingBULL1=1
ENDIF
CrossingBEAR1=0
IF WMA001 SMA002 then
CrossingBEAR1=1
ENDIF
timeframe(1 hour, default)
//Crossing areas definiton
WMA003=weightedaverage[period003](close)
WwMA003=weightedaverage[period003](WMA003)
SMA004=average[period004](close)
CrossingBULL2=0
IF WMA003 > SMA004 and WwMA003 < SMA004 then
CrossingBULL2=1
ENDIF
CrossingBEAR2=0
IF WMA003 SMA004 then
CrossingBEAR2=1
ENDIF
timeframe(default)
ONCE PXentry=round(0.6*Pentry)
highest1=highest[Pentry](high)
IF highest1 = highest1[PXentry] then
Re1=highest1
ENDIF
IF high > Re1 then
Re1=high
ENDIF
lowest1=lowest[Pentry](low)
IF lowest1 = lowest1[PXentry] then
S1=lowest1
ENDIF
If low 3 and hour<22 and DayOfWeek<=5 then
// Bedingungen zum Einstieg in Long-Positionen
IF NOT LongOnMarket AND CrossingBULL1=1 and CrossingBULL2=1 THEN
stoploss=(close – S1)/pipsize +2*pipsize
BUY 1 CONTRACTS AT MARKET
SET STOP PLOSS stoploss
SET TARGET PPROFIT Kp*stoploss
ENDIF
// Bedingungen zum Ausstieg von Long-Positionen
If LongOnMarket AND CrossingBEAR1=1 THEN
SELL AT MARKET
ENDIF
// Bedingungen zum Einstieg in Short-Positionen
IF NOT ShortOnMarket AND CrossingBEAR1=1 and CrossingBEAR2=1 THEN
stoploss=(Re1-close)/pipsize + 2*pipsize
SELLSHORT 1 CONTRACTS AT MARKET
SET STOP PLOSS stoploss
SET TARGET PPROFIT Kp*stoploss
ENDIF
// Bedingungen zum Ausstieg aus Short-Positionen
IF ShortOnMarket AND CrossingBULL1=1 THEN
EXITSHORT AT MARKET
ENDIF
ENDIF
Hi Leo, can you explain how the strategy works? I don’t know how to program and so it’s not easy for me to understand it by reading the code. THANKS!
Two SMA are crossing in a time frame (5min) while another 2 SMA are crossing in a higher Time Frame (1hour) stop loss is set to next support resistace.
Thanks Leo!
Hi Leo
something is missing in the strategy above because it does not work at all as it is
I don’t know, I just copy paste the strategy. The optimisation of the values I wrote them in the code: line 3 to 8
hello Leo I’m spending time on your strategy code. do you agree to try to include this code (see ITF file) and try to make it work. I don’t know how to do it alone yet. thank you. it is surely necessary to remove MMperiode from my code too …
//version a: ajout filtre MM
defparam cumulateorders=false
// — paramètres
taille = 1 //taille de contrat pour les prises de position
active3Bougies = 1 //active ou non une suite de 3 bougies consécutives cul plate ou non (1 = OUI / 0 = NON)
culPlat = 100 //cul plat en pourcentage (taille de la meche en % de taille global)
MMperiode = 20 //période de la moyenne mobile (filtre pour prises de position)
// — fin des paramètres
avg = average[MMperiode](close)
xClose = (open+high+low+close)/4
IF BarIndex=0 THEN
xOpen = open
xHigh = high
xLow = low
ELSe
xOpen = (xOpen[1] + xClose[1])/2
xHigh = Max(Max(high, xOpen), xClose)
xLow = Min(Min(low, xOpen), xClose)
ENDIF
irange = xhigh-xlow
red = xclose<xopen and ((xhigh-xopen)/irange)xopen and ((xopen-xlow)/irange)<=(100-culplat)/100
if active3Bougies then
redcons = summation[3](red)=3
greencons = summation[3](green)=3
else
redcons = red
greencons = green
endif
if not onmarket and redcons and xcloseavg then
buy taille contract at market
endif
//graph (xhigh-xopen)/irange
//graph greencons coloured(0,255,0)